- Date:
Infocus - Although inflation is reaching levels not seen for many years, central banks in most advanced economies hesitate to raise interest rates.
At quarterly meetings, the members of the Federal Open Market Committee (FOMC) are asked for their views on the future evolution of the US economy and the participants’ views on the fed funds rate are represented in a ‘dot plot’. In this issue of Infocus, EFG chief economist Stefan Gerlach looks at how these dots can be interpreted.
Every quarter, the members of the Federal Open Market Committee (FOMC) are asked for their views on the future evolution of the US economy. They are asked how they expect the unemployment rate, real GDP growth, headline PCE inflation, core PCE inflation and the federal funds rate to evolve over the next few years and at what levels they expect them to settle in the ‘longer run’.
Financial market commentary, not surprisingly, focuses on FOMC participants’ views on the federal funds rate, which are presented in a ‘dot plot’. Figure 1 below shows the most recent dot plot, which was released on 15 December 2021.
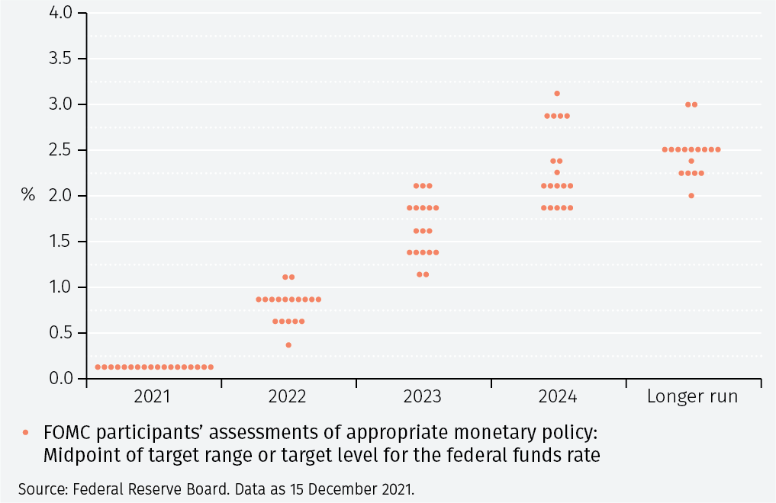
The dot plot shows individual FOMC members’ views about what interest rates they think the FOMC will set at the ends of the coming years and in the longer run to achieve its statutory objectives. Commentators often compute the median dot for the different horizons and interpret them as showing what interest rate FOMC members expect to set and how many times they expect to change interest rates.
Connecting the dots
This approach to the dot plots considers them as data but does not go further than that. But the dot plots can be seen as reflecting FOMC participants’ views about three aspects of US monetary policy:
- The steady-state value of the federal funds rate, that is, the level of the federal funds rate that is appropriate when economic conditions have ‘normalised’ in the sense of inflation having returned to the 2% target, real GDP growth having returned to trend and unemployment having reached its steady state level;
- The speed by which that adjustment will take place; and
- The number of months until the midpoint of the adjustment has taken place.
To extract that information, a smooth parametric function – whose parameters capture the steady state level, speed of adjustment and number of months to the midpoint – can be fitted to the data in the dot plots. (The details are presented in the Technical Appendix.)
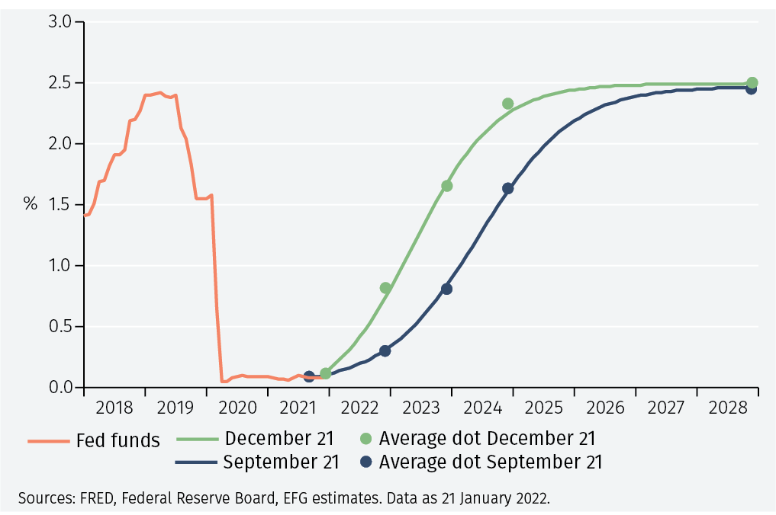
Figure 2 applies this approach to the dot plots for September and December 2021. Rather than showing all the dots, the average dots for 2021, 2022, 2023, 2024 and the ‘longer run’ are displayed. In doing so a maturity for the ‘long run’ must be selected: 7 years (84 months) is used in this analysis.1
The fitted curve is very close to the average dot for the different horizons and thus appears to capture the information in the dot plots well.
The fitted curve is a logistic function.2 It involves four parameters, which can be given the following interpretation:
i. The initial steady-state interest rate level (which is of little interest if only the latter part of the curve is fitted);
ii. The terminal steady state interest rate;
iii. The speed of adjustment;
iv. The time before half of the adjustment has been undertaken.
The function has several desirable properties. First, the line becomes horizontal as horizons in the distant future are considered. Since the longer run is defined by interest rates having settled at their steady state level, this is essential. Second, it allows the process of interest rate changes to have already started or to start sometime in the future. Third, it allows for the case in which FOMC participants believe that the steady state interest rate is below the current level. Fourth, it allows for negative interest rates.
That said, the logistic curve assumes that FOMC members expect interest rates will change from the current level. If they expect them to remain unchanged or change very little, it is difficult to fit the curve. Furthermore, the model cannot capture a situation in which FOMC participants believe that the adjustment to the longer run level may entail a temporary period of over- or under-shooting of the longer run rate.
Covid and the dots
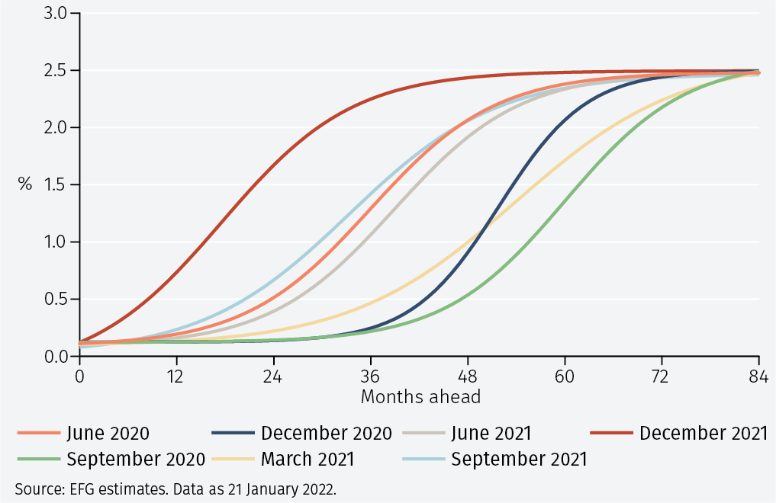
Next, this modelling technique is applied to all the dot plots for 2020-21 (no dot plot was published in March 2020). The resulting curves are shown in Figure 3.
The figure shows that in all cases, the estimated longer run steady state level of interest rates is about 2.5% (and, as expected, very close to the average dot for the longer run). Furthermore, the slopes of the curves appear similar, implying that the speed of adjustment to the longer run is broadly similar. Finally, the midpoint of the adjustment appears to vary. In June 2020, half the adjustment was expected to be achieved in 36 months, rising to 60 months in September the same year. It then started to fall, reaching a little less than 24 months by December 2021.
Focusing on the curve estimated on the most recent dot plot of last December, the estimates suggest interest rate increases in March, September and December 2022; March, June, September and December 2023; and June and December 2024, when rates are estimated at 2.25%. That forecast relies on data that are now more than a month old and likely to be revised when the next dot plot is released in March. Thus, it is merely illustrative.
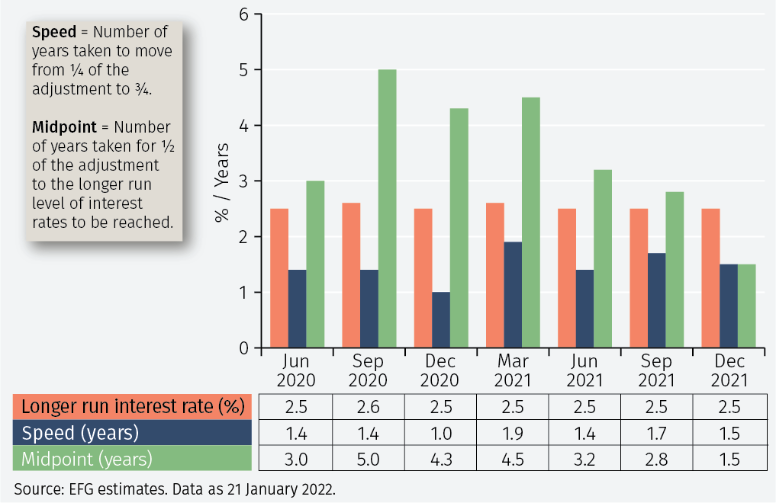
The longer-term interest rates, speed of adjustment and distance to the midpoint are all estimated directly when fitting the curves and are presented in Figure 4. Speed is here measured by the number of years it takes to move from ¼ of the adjustment to ¾, and the midpoint is measured by the number of years it takes for ½ of the adjustment to the longer-run level of interest rates to be reached.
As already seen, the longer-run interest rate is estimated to be about 2.5% and the speed of adjustment about 1.5 years, except in December 2020 when it is estimated to be 1 year. By contrast, the estimated number of years to the midpoint varies between 1.5 and 5 years.
The determinants of the changing curves
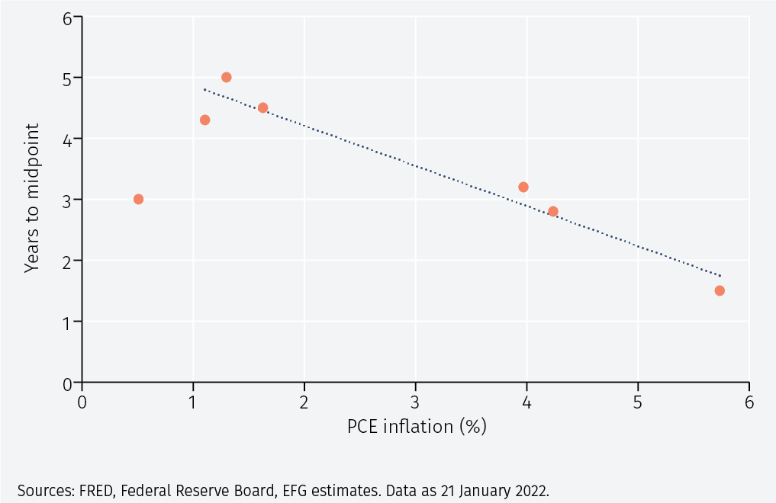
Having estimated the three variables that determine the shape of the curve, it is natural to ask how they vary with the state of the economy. A simple way to do so, is to compute the correlations between these three quantities and the rates of inflation and unemployment the month before the FOMC meetings (to account for reporting lags).
While most of the correlations are insignificant, there is a strong negative (-0.76) and significant correlation between PCE inflation and the time to the midpoint of the adjustment, as shown in Figure 5. With inflation below 2%, the dot plots of June 2020 – March 2021 signalled no interest rate increase for at least the coming three years. However, as inflation rose increasingly above 2%, the dot plots of June – December 2021 signalled that interest rate adjustments were imminent. Thus, the Fed’s thinking in this period about when to start raising interest rates appears largely determined by inflation.
Simulations
Figure 5 suggests that a one percentage point increase in inflation will make the FOMC want to complete half of the adjustment to the new longer run level of interest rates about 0.7 years earlier. This makes it possible to form a view of the path of interest rates that the FOMC might expect for alternative inflation rates.
Figure 6 shows the curve estimated on the December 2021 dot plot, for which the inflation rate in November was about 5.75%. That curve suggests three interest rate increases in March, September and December 2022.3
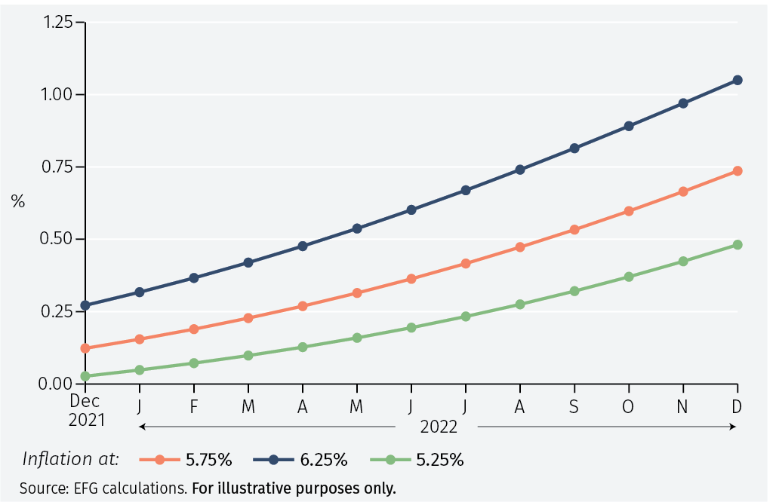
The figure also shows a curve assuming that inflation in November had been 6.25%, that is, 0.5% higher. That curve suggests that the FOMC would have raised rates immediately in December 2021 and that it would do so again in June, September and December 2022.
Finally, the figure contains a hypothetical interest path under the assumption that inflation in November 2021 had been 5.25%, that is, 0.5% lower. That curve shows two increases in June and December 2022.
These interest rate paths are far too simple to be interpreted as forecasts as they only consider how a single macroeconomic variable, inflation, impacts on the FOMC’s expectations of its future interest rate decisions. Nevertheless, they may serve as one input into a broader judgemental analysis of the outlook for US monetary policy.
Conclusions
With the FOMC ready to start the process of raising interest rates, market attention will focus on the dot plots associated with future FOMC meetings. The evidence to date suggests that the federal funds rate is likely to be changed imminently and eventually plateau at 2.5%, and that the Fed is reactive to changes in the inflation outlook. Whether this will continue to be the case remains to be seen.
1 The Fed says that the longer run may be in 5- 6 years. Since a too tight definition may constrain the curves, we use 7 years. In any case, the fitted curves tend to become horizontal much before 7 years. See www.federalreserve.gov/monetarypolicy/files/fomcprojtabl20171213.pdf
2 The function looks like a flattened S: it is initially horizontal, then rises (or falls) until it reaches a new level at which it becomes horizontal again
3 These guesses assume that the Fed is more likely to raise rates in the months in which it releases updated projections
Important Information
The value of investments and the income derived from them can fall as well as rise, and past performance is no indicator of future performance. Investment products may be subject to investment risks involving, but not limited to, possible loss of all or part of the principal invested.
This document does not constitute and shall not be construed as a prospectus, advertisement, public offering or placement of, nor a recommendation to buy, sell, hold or solicit, any investment, security, other financial instrument or other product or service. It is not intended to be a final representation of the terms and conditions of any investment, security, other financial instrument or other product or service. This document is for general information only and is not intended as investment advice or any other specific recommendation as to any particular course of action or inaction. The information in this document does not take into account the specific investment objectives, financial situation or particular needs of the recipient. You should seek your own professional advice suitable to your particular circumstances prior to making any investment or if you are in doubt as to the information in this document.
Although information in this document has been obtained from sources believed to be reliable, no member of the EFG group represents or warrants its accuracy, and such information may be incomplete or condensed. Any opinions in this document are subject to change without notice. This document may contain personal opinions which do not necessarily reflect the position of any member of the EFG group. To the fullest extent permissible by law, no member of the EFG group shall be responsible for the consequences of any errors or omissions herein, or reliance upon any opinion or statement contained herein, and each member of the EFG group expressly disclaims any liability, including (without limitation) liability for incidental or consequential damages, arising from the same or resulting from any action or inaction on the part of the recipient in reliance on this document.
The availability of this document in any jurisdiction or country may be contrary to local law or regulation and persons who come into possession of this document should inform themselves of and observe any restrictions. This document may not be reproduced, disclosed or distributed (in whole or in part) to any other person without prior written permission from an authorised member of the EFG group.
This document has been produced by EFG Asset Management (UK) Limited for use by the EFG group and the worldwide subsidiaries and affiliates within the EFG group. EFG Asset Management (UK) Limited is authorised and regulated by the UK Financial Conduct Authority, registered no. 7389746. Registered address: EFG Asset Management (UK) Limited, Leconfield House, Curzon Street, London W1J 5JB, United Kingdom, telephone +44 (0)20 7491 9111.