- Date:
The combination of prolonged easy monetary accommodation and a post-Covid rebound in activity has led to concerns about US inflation spiralling out of control. In this issue of Infocus Daniel Murray looks in more detail at the underlying dynamics. The main conclusion is that, whilst there are indeed reasons to believe there will be some increase this year, inflationary forces are expected to remain benign.
Introduction
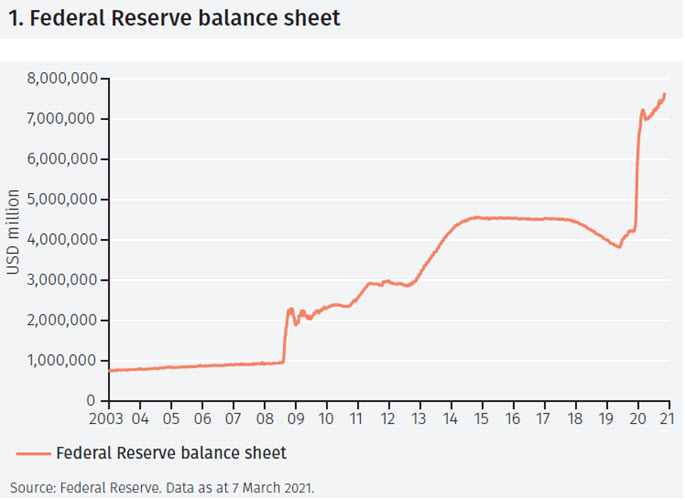
Since the onset of the Global Financial Crisis the Federal Reserve’s balance sheet has increased by a factor of eight from around $950 billion in 2008 to about $7.6 trillion at the time of writing. Of this huge amount, $3.4 trillion – over half the total increase – was added over the past 12 months. Moreover, economic activity is expected to rebound strongly this year; the IMF expects US GDP to expand by 5.1% in 2021 relative to the Fed’s longer run expectations for GDP to grow by 1.8% per annum. If the IMF’s forecast turns out to be a good approximation of the outturn, this will be the best year for US GDP growth since 1984. According to some, this combination of easy money and strong growth provides the ideal conditions for a sharp increase in inflation. Should we be concerned?
This note explores four different phenomena in this context:
➡ Base effects
➡ Distributional impacts
➡ Alternative measures of inflation
➡ Capacity utilisation
Base effects
In thinking about inflation, it is important to distinguish between one off increases in the price level that have a transient impact and more permanent increases in the inflation trend. As a direct consequence of the Covid-19 pandemic, inflation fell sharply last year as many parts of the economy experienced extreme stress. If economic activity continues to normalise as the year progresses, comparisons with the lows of last year become easier and inflation will rise. However, this should not be confused with an increase in the inflation trend.
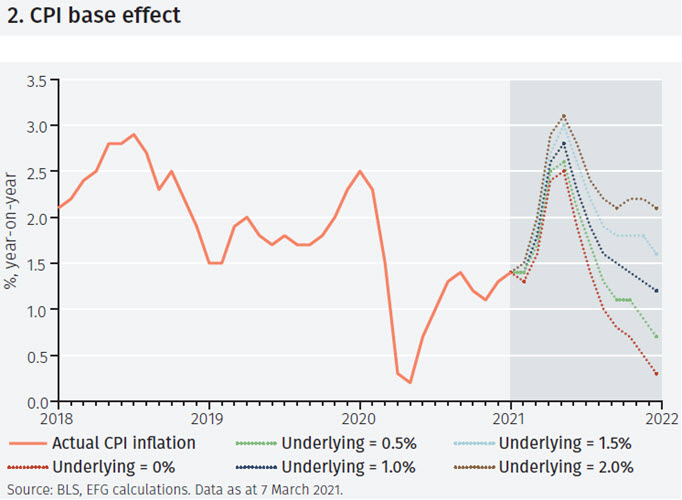
Figure 2 illustrates what would happen according to different scenarios for inflation this year. Under the scenario in which the price level is unchanged this year – underlying inflation of 0% – the year-over-year percent change in the CPI increases sharply from 1.3% at the end of last year to a peak of 2.5% in May of this year before falling back to 0.3% by year end. If CPI inflation this year is a steady 1.5% – still comfortably below the Fed’s 2% target – the year-over-year percent change in the CPI peaks at 3.0% in May but then declines to 1.6% by the end of the year.
Despite the fact that underlying trends in inflation remain benign, such scenarios will give the impression for a brief period of time that inflation is starting to run out of control.
There will likely be a confusion by some between the base effect and underlying inflation pressures. Some of the increase in inflation due to the base effect may well be attributed incorrectly to a more permanent rise in inflation and this is likely to be reflected in an increase in market sensitivity. One could, for example, imagine in such a scenario an increase in equity and bond market volatility. However, this should prove short lived as inflation subsides.
Distributional impacts
A separate feature of the past year is that different parts of the economy have been impacted in very different ways by the coronavirus crisis. For example, some parts of the service sector have experienced a profound contraction in activity whilst other parts of the economy, such as online retail sales and food delivery, have enjoyed a boom in activity. A corollary is that there has been an unusual widening in the range of inflation rates across the underlying components that feed into the aggregate.
Figures 3a and 3b illustrate this point. Using the components that feed into the Cleveland Fed’s measure of median inflation, the charts show how the range between the most and least inflationary components widened significantly last year. There has been a narrowing since then although the range remains unusually wide relative to history. Sometimes large variations in energy sector prices have a disproportionate impact – Figure 3b excludes energy but the overall message remains the same.
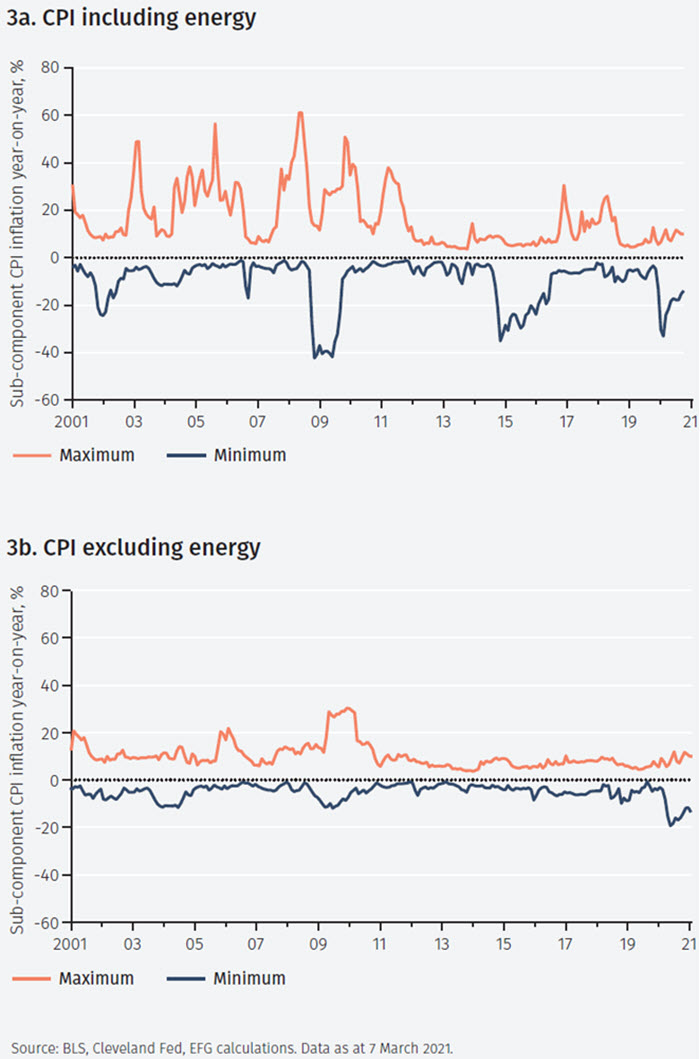
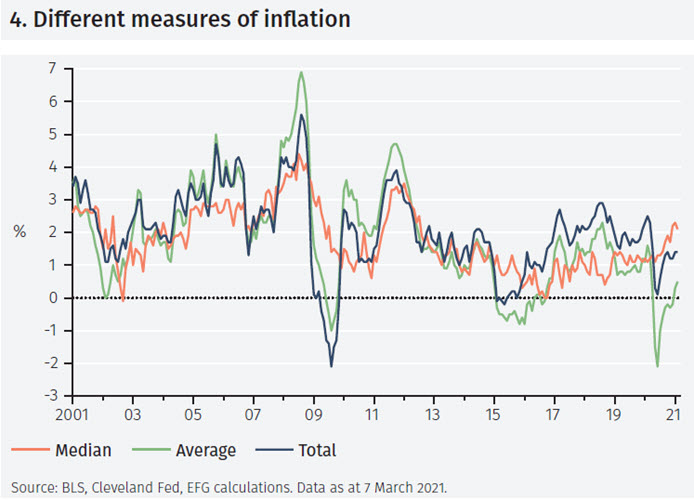
It is interesting to note that the decline in inflation last year was driven by a collapse in prices in some parts of the economy, as evidenced by the sudden sharp drop in the lower end of the range, rather than a decline in all measures of inflation - the upper end of the range increased marginally. This is also captured in the difference between the median (orange line) and the simple unweighted average inflation measure (green line) derived from the Cleveland Fed components and shown in Figure 4.
Unsurprisingly the simple average (green line) tracks closely the weighted average or total measure (blue line) of CPI inflation (this is the standard headline measure of CPI inflation that is widely reported). As and when the lower end of the inflation range rises so one would expect the simple and weighted average measures to increase toward the median.
This is one way in which we will be able to track whether any rise in inflation is simply a part of the normalisation of the economy or if there is a genuine increase in underlying inflationary forces. If the lower end of the range rises – signifying less deflation – whilst the upper end stays largely unchanged that would be consistent with normalisation. If, however, the upper end of the range rises at the same time as the gap narrows that would be consistent with a shift upward in the distribution of inflation and a higher trend.
Alternative measures of inflation
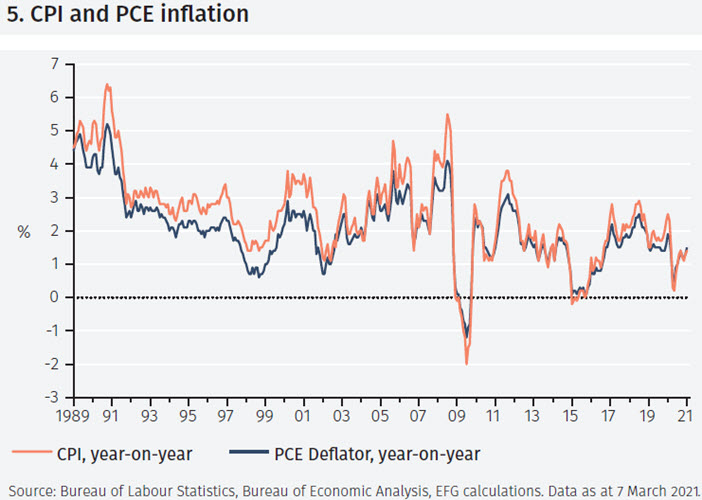
The third element of this analysis focuses on conceptual differences. Most countries in the world use a Consumer Price Index to estimate the price level and the US is no different in this regard. However, a popular alternative in the US is the Personal Consumption Expenditures (PCE) deflator. Indeed, the Federal Reserve’s preferred measure of inflation is based on the core PCE deflator, which excludes food and energy. The differences can be important. For example, one index might measure inflation as being above the central bank’s target whereas according to the other inflation is below target. Whilst the trends in the two measures are usually similar there can be meaningful differences in the level.
Figure 5 shows measures of inflation based on both indices. For much of the time the CPI measure exceeds the PCE measure although the gap between the two has been small over the period of time since the coronavirus crisis started.
There are numerous academic articles exploring the differences between these two price indices.1 These differences fall into four categories:
• Weight: the same items are weighted differently in the aggregate.
• Scope: some items are included in one measure but not the other.
• Formula: there are technical differences in how the indices are constructed and the methodologies used.2
• Other: anything else including factors such as seasonal adjustments.
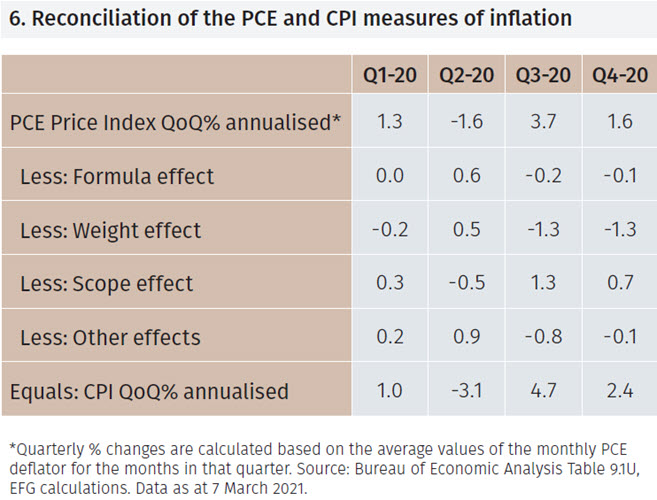
Of these four categories the most important is usually considered to be Weight followed by Scope. The Bureau of Economic Analysis (BEA) produces a table that reconciles the PCE and CPI measures of inflation according to these four categories. Quarterly data for 2020 is shown in Figure 6.
A full analysis is beyond the scope of this report but a few points are worth highlighting:
➡ Energy. Contrary to popular belief, the direct impact of energy on price indices is relatively small. The weight of ‘Gasoline and other energy goods’ in the PCE deflator is only 1.8% whilst the equivalent category for the CPI (‘Energy Commodities’) has a weight of 3.0%. However, it is also true that the indirect impact via transportation costs, utilities bills and other input costs is much greater.
➡ Housing. This is the main source of differences in the Weight category. The weight of ‘Housing and utilities’ services in the PCE is 19.5% whilst the combined weight of the ‘Shelter’ and ‘Energy services’ components in the CPI is 36.4%.
➡ Medical Services. The main items within the Scope category relate to medical services: ‘Physician services’ and ‘Hospital and nursing home services’. This is because the PCE deflator includes medical services that are purchased for individuals by their employers whereas the CPI does not. For reference, the average impact of these two items in 2020 was 27 basis points per quarter.
Whilst the direct energy weight in both price indices is small, energy goods are prone to occasional large movements so there are times when it influences the aggregate. In such situations it is clear the CPI measure will be more impacted since its exposure to energy goods is two-thirds greater than for the PCE deflator. And the effect will be magnified by the indirect impact of higher energy input costs into other parts of the economy.
Similarly, the CPI is almost twice as sensitive to housing costs as the PCE deflator. And, of course, differences in the scope of medical services are of growing importance given the rising prominence of health care in the US economy due both to the legacy of the coronavirus but also because of the aging population.
These differences between the PCE and CPI measures of inflation are of relevance in two main ways. First, because they may offer conflicting information about both the level of and trend in inflation. Secondly, even if the headline measures look similar, changes in the two indices may be driven by diverse factors. As the US economy recovers from the Covid-19 crisis it will be important to understand the causes of changes in inflation and how the two price indices are impacted. If one measure were to indicate a sharp increase in inflation whilst the other did not that is likely of less concern than if both measures indicate a surge in pricing pressures.
Capacity utilisation
The coronavirus crisis was associated with a sudden stop in many business activities and a sharp rise in unemployment, despite mitigating government programs. While it is possible for inflation to rise even if growth is weak, such as happened in the 1970s, it is unusual. A more typical process is one in which the economy experiences capacity constraints that then translate into higher wages and prices. Companies are able to charge higher prices because their goods and services are in short supply while workers are able to demand higher wages because companies are producing at high capacity.
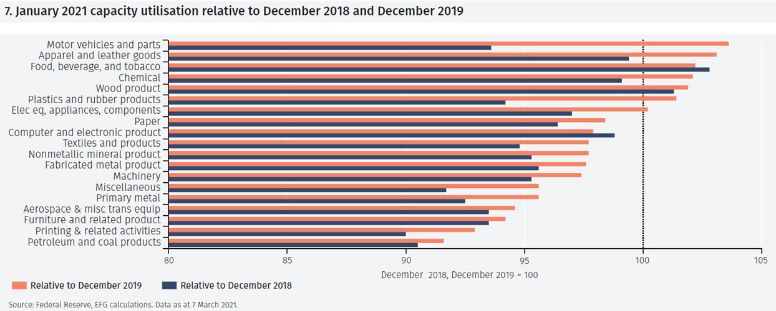
There are a number of different ways in which capacity constraints materialise. For example, when unemployment rates are low that usually signifies that production is relatively high. Figure 6 captures this dynamic via capacity utilisation rates; unemployment rates would have illustrated a similar point. The chart shows capacity utilisation in January this year relative to both December 2019 (immediately pre-covid) and December 2018 (since industrial production growth had already started to slow from late 2018). The categories are ranked from left to right according to January’s data relative to December 2019.
Figure 7 shows how, in 12 out of the 19 categories of production, capacity utilisation is below the December 2019 level, while it is below the December 2018 level in 17 out of 19 categories. Moreover, for those categories for which capacity utilisation has risen above its December 2018 or December 2019 levels the overshoot is modest. Such conditions would not normally be associated with rampant inflationary forces.
Conclusions
The combination of prolonged easy monetary accommodation and a post-covid rebound in activity has led to concerns about inflation spiralling out of control. For the time being, these concerns appear unwarranted. Capacity utilisation is low across much of the US economy, unemployment rates remain elevated and a high degree of uncertainty persists.
It is true that there may well be an increase in inflation as measured over the next few months but this will be largely due to easy comparisons with last year that will wash out in subsequent months. Nonetheless it is important to remain vigilant to the possibility of a more permanent increase in trend inflation.
One way to monitor underlying inflationary forces is to consider the distribution of inflation in the components that make up the headline index. A normalisation of this distribution is to be expected; if the distribution appears to shift higher that would be more concerning. Separately it is important to be cognisant of different measures of US inflation and how these are impacted by different forces. An apparent increase in CPI inflation that is not confirmed by an increase in PCE inflation is of less concern than an increase in both measures of inflation.
Finally, it is also worth remembering that the Federal Reserve has indicated a tolerance for inflation to rise above its 2% target for some time to counterbalance the prolonged period of time for which inflation has been below target. A gentle rise in inflation that is not accompanied by tighter policy is usually beneficial to economies since it helps to reduce the real value of debt across corporates, individuals and the public sector.
Footnotes
1 See for example: “Comparing the Consumer Price Index and the Personal Consumption Expenditures Price Index” by Clinton P. McCully, Brian C. Moyer and Kenneth J. Steward, Survey of Current Business, November 2007; “CPI vs PCE Inflation: Choosing a Standard Measure” by James Bullard, Federal Reserve Bank of St Louis, July 2013; “PCE and CPI Inflation: What’s the Difference” by Joseph G. Haubrich and Sara Millington, Federal Reserve Bank of Cleveland, April 2014; “A comparison of PCE and CPI: Methodological Differences in US Inflation Calculation and their Implications” by Noah Johnosn, Bureau of Labor Statistics, November, 2017.
2 The CPI is constructed based on a modified Laspeyres formula whilst the PCE is constructed using the Fisher-Ideal methodology.
Important Information
The value of investments and the income derived from them can fall as well as rise, and past performance is no indicator of future performance. Investment products may be subject to investment risks involving, but not limited to, possible loss of all or part of the principal invested.
This document does not constitute and shall not be construed as a prospectus, advertisement, public offering or placement of, nor a recommendation to buy, sell, hold or solicit, any investment, security, other financial instrument or other product or service. It is not intended to be a final representation of the terms and conditions of any investment, security, other financial instrument or other product or service. This document is for general information only and is not intended as investment advice or any other specific recommendation as to any particular course of action or inaction. The information in this document does not take into account the specific investment objectives, financial situation or particular needs of the recipient. You should seek your own professional advice suitable to your particular circumstances prior to making any investment or if you are in doubt as to the information in this document.
Although information in this document has been obtained from sources believed to be reliable, no member of the EFG group represents or warrants its accuracy, and such information may be incomplete or condensed. Any opinions in this document are subject to change without notice. This document may contain personal opinions which do not necessarily reflect the position of any member of the EFG group. To the fullest extent permissible by law, no member of the EFG group shall be responsible for the consequences of any errors or omissions herein, or reliance upon any opinion or statement contained herein, and each member of the EFG group expressly disclaims any liability, including (without limitation) liability for incidental or consequential damages, arising from the same or resulting from any action or inaction on the part of the recipient in reliance on this document.
The availability of this document in any jurisdiction or country may be contrary to local law or regulation and persons who come into possession of this document should inform themselves of and observe any restrictions. This document may not be reproduced, disclosed or distributed (in whole or in part) to any other person without prior written permission from an authorised member of the EFG group.
This document has been produced by EFG Asset Management (UK) Limited for use by the EFG group and the worldwide subsidiaries and affiliates within the EFG group. EFG Asset Management (UK) Limited is authorised and regulated by the UK Financial Conduct Authority, registered no. 7389746. Registered address: EFG Asset Management (UK) Limited, Leconfield House, Curzon Street, London W1J 5JB, United Kingdom, telephone +44 (0)20 7491 9111.