- Date:
- Author:
- Daniel Murray
Infocus - Inflation has surged to levels not seen in decades due to rising commodity prices, supply chain bottlenecks and tight labour markets. These factors apply to most developed countries, but not to Switzerland where inflation remains low. In this edition of Infocus, GianLuigi Mandruzzato compares Swiss inflation to that in the US and the eurozone and draws some policy implications.
Many investors have been caught off-guard by the recent rise in bond yields. From early May to the time of writing (26 September), the yield on the 10-year US Treasury bond has increased by around 120bps of which a third of the move occurred in September alone. This has translated into a capital loss of about 8% since early May and over 3% in September. With inflation coming down and the Fed signalling that it is close to the end of its hiking cycle, such moves are perhaps surprising. In this issue of Infocus, Daniel Murray outlines a simple way to think about the yield curve that helps put recent market behaviour in context.
Introduction and background
The 10-year Treasury yield has consistently overshot consensus expectations over the past four months and indeed for most of the past 12 months, as shown in Figure 1.
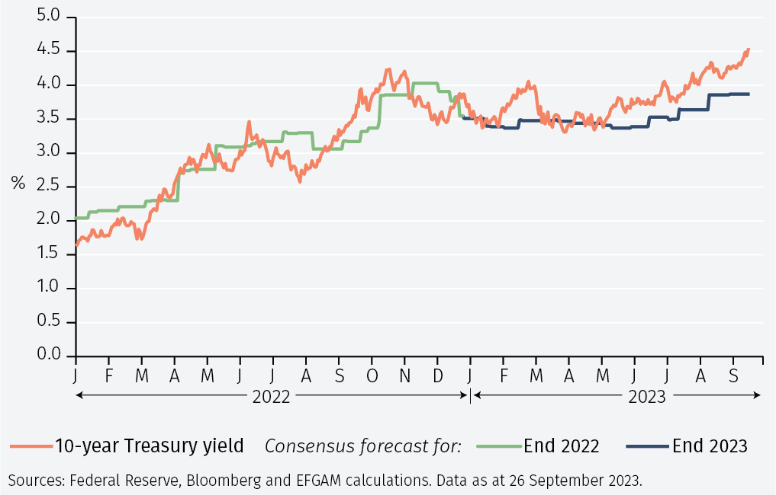
There are many reasons why this may be the case: Ongoing Federal Reserve balance sheet shrinkage has removed an important source of demand for Treasury bonds;
- The US Treasury has issued large amounts of debt to fund the budget deficit this year, increasing the supply of government paper;
- Futures positioning has moved sharply against US Treasuries, with the largest number of short contracts outstanding since records began in 1992;1
- Chinese and Japanese holdings of Treasury bonds have declined sharply over the past two-and-a-half years and continue to trend lower.
No doubt all of these factors have played their part in pushing yields higher and in keeping them high.
Thinking about these factors is helpful in explaining what has happened in the past, although their complicated interplay makes it difficult to predict what is likely to happen in the future. However, it is instructive to look to history as a guide for the potential level of yields as well the shape of the curve. In practice, the hypothetical yield curve that results from this exercise is highly unlikely to materialise exactly, since markets are volatile. It is nonetheless useful as a starting point to help us think about the direction of yields and the risks inherent in current market pricing.
An upward sloping curve is normal
In normal circumstances the US yield curve is positively sloped. In simple terms, the prices of longer duration assets are more volatile than shorter duration assets, so investors require greater compensation to hold them.2 Over the period starting in January 1980 and ending in June 2023 (over 40 years) the 3-month Treasury yield has averaged a little over 4%, the 2-year yield has averaged about 4.7% (0.7% higher than the 3-month), the 5-year yield about 5.2% (0.5% higher than the 2-year) and the 10-year yield 5.7% (0.4% higher than the 5-year).
The 3-month part of the curve is critical as the anchor point on to which additional yield is added to compensate for the increase in risk. In turn, the 3-month yield is highly correlated to the Fed funds rate. According to the infamous dot plots, there is a strong consensus within the FOMC that the Fed funds rate will settle at around 2.5% in the longer run. Applying the average metrics derived above therefore suggests a good starting point for thinking about the yield curve is the 2-year yield at around 3.2%, the 5-year yield at 3.7% and the 10-year yield at 4.1%. The current (orange line), historical average (green line) and hypothetical (blue line - assuming the Fed funds rate is at 2.5% in the longer run) yield curves are shown in Figure 2.
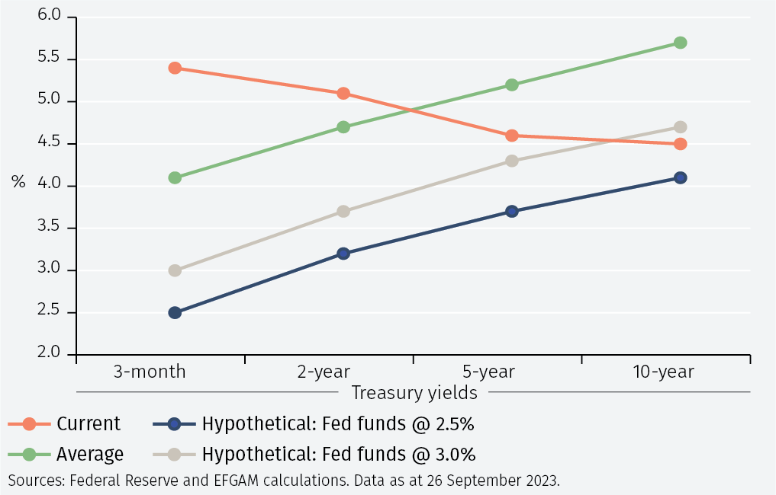
The current 10-year yield is a little higher than that suggested by the average analysis with the Fed funds rate at 2.5%. However, if one believes that the Fed funds rate will settle at closer to 3% in the longer run (the grey line in Figure 2) then the gap between current and hypothetical yields narrows; the hypothetical average 10-year Treasury yield with the Fed funds rate at 3% is 4.7%, which is close to the yield at the time of writing. Regardless of whether one believes the Fed funds rate will settle at 2.5% or 3.0% or even higher, this methodology helps explain why the 10-year yield has been stubbornly resistant to remaining above 4%.
Thinking about ranges
Markets often overshoot or undershoot theoretical norms. It is therefore helpful to get a sense of the possible range of outcomes for the yield spreads. One could take maximum and minimum values over the entire sample. However, that provides a very wide range of outcomes that is not very informative. One simple alternative is to smooth the data by looking at moving averages. The results using a 10-year moving average are shown in Figure 3. Using a shorter period for the moving average would result in a wider range.3
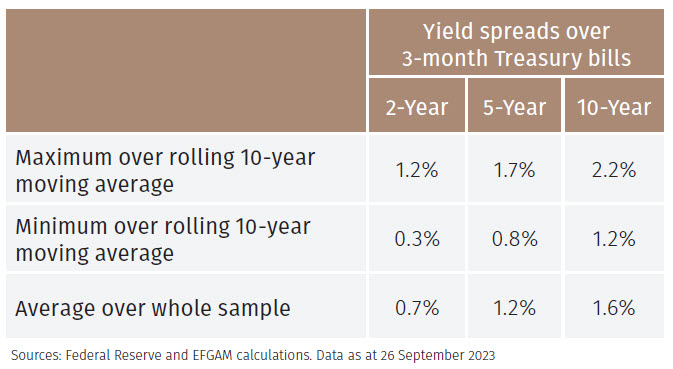
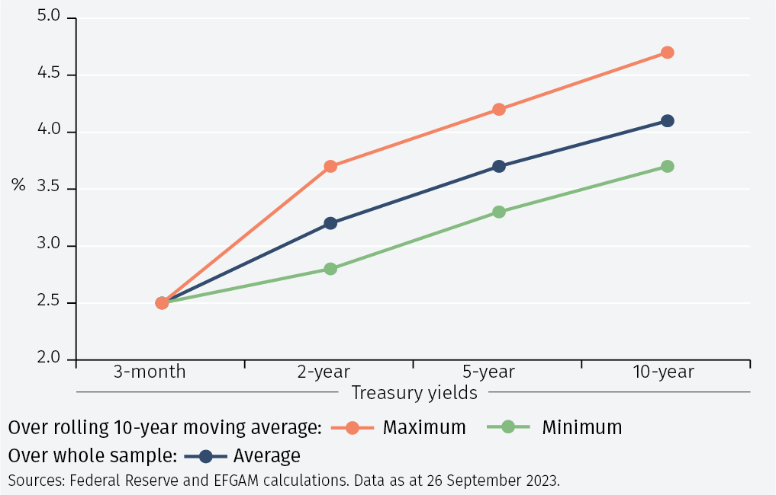
For example, if you believe in a stronger economy with inflation higher for longer, you could apply a number of 2.2% to the slope between the 10-year and 3-month Treasury yields. If you are more dovish then you could apply a number of 1.2% to the slope. In turn, this would suggest a range for the 10-year Treasury yield of between 3.6% and 4.7%. The ranges and the average yield curve based on the Fed funds rate at 2.5% are shown in Figure 4.
The catalyst for change
The catalyst that would normally encourage current yields to converge towards hypothetical yields is a shift lower in rate expectations, eventually followed by actual rate cuts. In other words, the market will anticipate a cut in the Fed funds rate before it happens. This would occur if core inflation falls or if the unemployment rate rises, for example in response to a negative shock.
Based on current yields moving towards the average hypothetical, it is possible to estimate the performance of the different maturity bonds. These are shown in Figure 5.
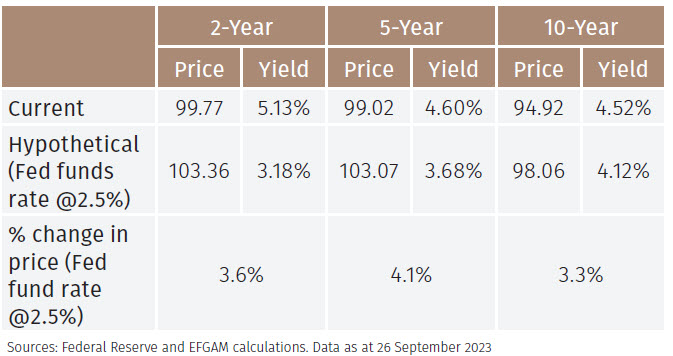
For example, if the 2-year yield moves from its level at the time of writing to the hypothetical average yield this would see the price of the bond rally by 3.6%.4
While the shorter end of the curve is tied to the actual Fed funds rate, the longer end of the curve is impacted by shifting expectations about the Fed funds rate in the future. Since market expectations move ahead of the Fed cutting rates, one would expect the 5-year yield to drop before the 2-year yield and that part of the curve currently appears to be the most attractive.
Conclusion
In conclusion, a simple analysis based on historical averages explains well the recent behaviour of the longer end of the yield curve and provides a useful template for thinking about how yields may evolve over the next 12 months. There are of course other methodologies that could be used to analyse the appropriate level of yields, such as estimating the impact of different risk premia. However, the methodology in this report has the enormous benefit of simplicity and it is not clear that a more complicated methodology would produce results that are any more reliable or informative.
The time-period used for the averaging process was arbitrary and it could be argued that an alternative reference period should be used. For example, if one believes that the post-GFC period of widespread quantitative easing was unusual and we are returning to a pre-GFC environment, one could use an average that stops in 2007. It is interesting to note that calculating the averages from January 1980 to December 2007 results in a different level of yields but little difference in terms of the slope of the curve.5
Furthermore, there is no particular reason why yields and spreads should return to their long-term averages. However, there are good reasons to believe that the yield curve slope will turn positive, such as the observation that investors generally require higher prospective returns from more volatile assets. Furthermore, the yield curve would be expected to steepen mechanically as and when the Fed cuts rates. Where the Fed stops and what is the longer run level of the Fed funds rate will therefore be crucial in determining the appropriate level of yields at the longer end of the curve; that the yield curve slope will turn positive at some point is less contentious.
Whilst the methodology described in this report is certainly not the only approach and it has some limitations, it has the enormous appeal of being simple to apply and easy to understand. It therefore has utility as an analytical tool and a framework around which to think about bond yields and can be thought of as a reference position to be challenged or confirmed as market conditions evolve over time.
1 This is connected to hedge funds shorting Treasury futures and buying Treasury bonds in the cash market, exploiting small differences in the prices. See ‘The debt fuelled bet on US Treasuries that’s scaring regulators’ by Kate Duguid, Costas Mourselas and Ortenca Aliaj, Financial Times, 26 September 2023. https://www.ft.com/content/a8348e2a-a90f-474c-baa6-8c2eb0e263c2
2 This is sometimes referred to as the ‘term premium’.
3 Using a 5-year moving average instead of a 10-year moving average suggests a range of 0.5% to 2.6% for the 10-year minus 3-month Treasury yield spread
4 Dependent on how long it takes for prices to adjust to the hypothetical, investors would also receive some coupon payments.
5 Over the period starting in January 1980 and ending in December 2007 the 3-month Treasury yield averaged 5.9%, the 2-year yield averaged 6.7% (0.8% higher than the 3-month), the 5-year yield averaged 7.2% (0.5% higher than the 2-year) and the 10-year yield 7.5% (0.4% higher than the 5-year). The difference between the average 10-year and 3-month yields is 1.6% in this sub-sample, identical to the difference in the whole sample.
Important Information
The value of investments and the income derived from them can fall as well as rise, and past performance is no indicator of future performance. Investment products may be subject to investment risks involving, but not limited to, possible loss of all or part of the principal invested.
This document does not constitute and shall not be construed as a prospectus, advertisement, public offering or placement of, nor a recommendation to buy, sell, hold or solicit, any investment, security, other financial instrument or other product or service. It is not intended to be a final representation of the terms and conditions of any investment, security, other financial instrument or other product or service. This document is for general information only and is not intended as investment advice or any other specific recommendation as to any particular course of action or inaction. The information in this document does not take into account the specific investment objectives, financial situation or particular needs of the recipient. You should seek your own professional advice suitable to your particular circumstances prior to making any investment or if you are in doubt as to the information in this document.
Although information in this document has been obtained from sources believed to be reliable, no member of the EFG group represents or warrants its accuracy, and such information may be incomplete or condensed. Any opinions in this document are subject to change without notice. This document may contain personal opinions which do not necessarily reflect the position of any member of the EFG group. To the fullest extent permissible by law, no member of the EFG group shall be responsible for the consequences of any errors or omissions herein, or reliance upon any opinion or statement contained herein, and each member of the EFG group expressly disclaims any liability, including (without limitation) liability for incidental or consequential damages, arising from the same or resulting from any action or inaction on the part of the recipient in reliance on this document.
The availability of this document in any jurisdiction or country may be contrary to local law or regulation and persons who come into possession of this document should inform themselves of and observe any restrictions. This document may not be reproduced, disclosed or distributed (in whole or in part) to any other person without prior written permission from an authorised member of the EFG group.
This document has been produced by EFG Asset Management (UK) Limited for use by the EFG group and the worldwide subsidiaries and affiliates within the EFG group. EFG Asset Management (UK) Limited is authorised and regulated by the UK Financial Conduct Authority, registered no. 7389746. Registered address: EFG Asset Management (UK) Limited, Park House, 116 Park Street, London W1K 6AP, United Kingdom, telephone +44 (0)20 7491 9111.