- Date:
Infocus - Inflation has surged to levels not seen in decades due to rising commodity prices, supply chain bottlenecks and tight labour markets. These factors apply to most developed countries, but not to Switzerland where inflation remains low. In this edition of Infocus, GianLuigi Mandruzzato compares Swiss inflation to that in the US and the eurozone and draws some policy implications.
Over the last year or two, inflation projections have often been wrong, forcing forecasters to revise their predictions upward repeatedly. In this issue of Infocus, EFG Chief Economist Stefan Gerlach looks at this matter, asking why it has been so difficult to forecast US inflation over the past couple of years. Problems with forecasting US inflation may have arisen from a focus on core inflation as a measure of trend inflation, which may have led policymakers to believe incorrectly that the rise in price pressures would be temporary. Another factor may be the use of the unemployment rate as measure of labour market slack. While it is normally closely linked to the vacancies/unemployment ratio, recently this latter series has indicated exceptional labour market tightness and appears to fit the data better. This alternative view of inflation suggests that monetary policy is likely to be tighter for longer than commentators previously anticipated.
The behaviour of inflation over the last 12 months has taken forecasters and central bankers by surprise and led them to revise their forecasts upward repeatedly. For instance, in September 2021 the median member of the Federal Open Market Committee (FOMC) that sets US monetary policy expected PCE inflation of 2.2% between Q4 2021 and Q4 2022.1 By December 2021, it had raised that forecast to 2.6%. By March 2022, it raised it again to 4.3%, in June 2022 to 5.2% and in September to 5.4%.
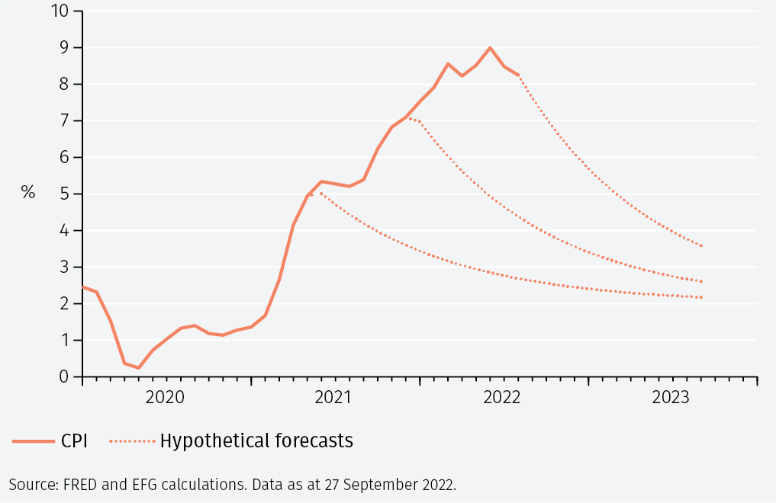
Moreover, it has often been noted that while many forecasters have predicted a decline in inflation for some time, inflation has in fact increased. Figure 1 provides a hypothetical illustration.
What are we to make of these forecasting failures? What might have caused them?
As a start it is important to be clear about the structure of forecasts and what one would expect from them. Two characteristics are important.
- Forecasts revert to the average level of the variable being forecasted. Thus, if inflation has been broadly in line with a central bank’s inflation target of 2% in the recent past and that it is seen as credible, then forecasts of inflation will converge to 2% over time, as shown in Figure 1.
- While actual inflation tends to revert to the mean, new unforecastable shocks occur regularly. Usually, such shocks are small and cancel each other out over time. Recently, however, they have been large and have reinforced each other in pushing inflation higher as suggested by the pattern of forecast errors in Figure 1.
While Figure 1 thus does not on its own confirm that the forecast model is wrong, a recent paper presented at the September 2022 Brookings conference by Ball, Leigh and Mishra (BLM) explores more formally why it has been so difficult to forecast US inflation recently.2
The authors focus on two potential factors: the mismeasurement of core inflation and labour market slack.
Measures of core inflation
The observed inflation rate – headline inflation – often behaves erratically because of large movements in the prices of energy and food. To get a clearer sense of underlying inflation pressures, analysts often look at a measure of inflation – core inflation – that disregards these factors.
Importantly (and as shown below), increases in energy and food prices that raise headline inflation do not usually appear to have much impact on core inflation. Thus, such increases can be thought of as temporary and of little significance to inflation beyond the near term.
To understand why this may be the case, suppose that the weight of energy in the CPI is 10% (it is 8.8% in the US) and that energy prices rise by 40%. Suppose also that all other prices are unchanged. If the overall price index was 100, the energy price shock will move it up to 104. Inflation will then be (104-100)/100 = 4%. However, since inflation is computed as the annual change in the price index, a year after the change in energy prices the inflation rate will fall back to (104-104)/104 = 0%.
BLM hypothesise that that these findings may be spurious, noting that there are many other factors beyond energy and food prices that may mask the underlying inflation trend but that nevertheless are incorporated in core inflation. This could result in a mismeasurement of underlying inflation pressures and a spurious conclusion that shocks to headline inflation have no lasting impact on underlying inflation as measured by core inflation.
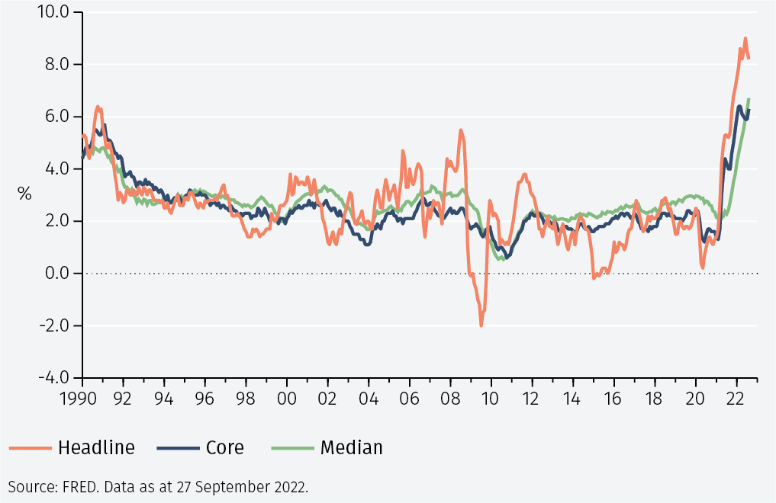
BLM propose that instead of using core inflation, a better measure of underlying inflation pressures is the median inflation rate. This is obtained by computing the percentage change of the prices of all items in the CPI, ordering them from the lowest to the highest and taking that in the middle.3
Figure 2 shows headline, core and median inflation. It is evident that while core inflation is more stable than headline inflation, median inflation is even more stable.4 Below we show that this matters for the interpretation of the inflation process.
Measures of labour market slack
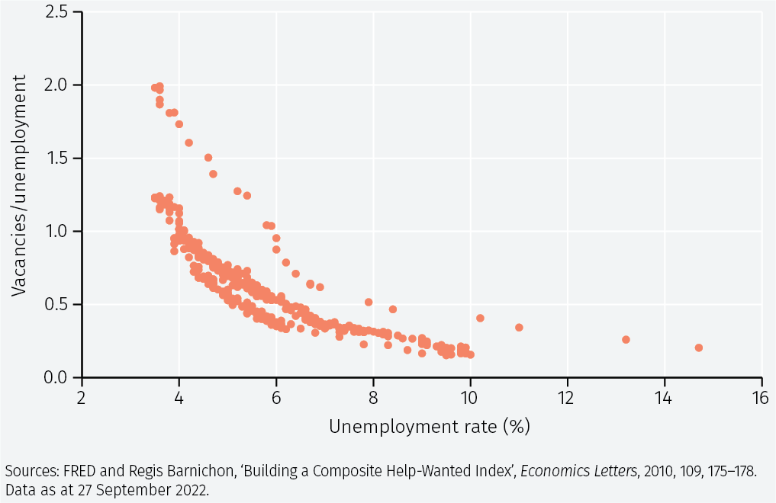
BLM also take issue with the standard practice of measuring labour market slack by the unemployment rate rather than by the ratio of vacancies to unemployment (V/U). Using data from 1990 onward, the figure below shows the relationship between V/U and the unemployment rate.
Interestingly, for moderate unemployment rates, the relationship looks broadly linear. That implies that the two measures of labour market slack are very highly correlated, making it difficult to distinguish between their relative strength as a measure of labour market slack.
However, for very high and very low unemployment rates, the line turns to a curve that flattens as it approaches the two axes. In those situations, the V/U ratio will change a lot or very little in response to changes in the unemployment rate. Over the full range of unemployment rates, the relationship is thus shifting. That means that data from the last few years in which the unemployment rate at different times has been very high and very low will be helpful in determining whether the unemployment rate or the V/U ratio is more closely tied to underlying inflation pressures. It is worth emphasising that since the ratio of vacancies to unemployment has been exceptionally high in recent months, BLM’s preferred measure of the tightness of labour markets suggests that inflationary pressures have been stronger than the Fed may have perceived.
Price shocks, labour market slack and inflation
To explore more formally the importance of how underlying inflation and labour market slack are measured, we estimate two simple statistical models using data since 1991.5
The first model includes three variables:
1. The difference between headline and core inflation as a measure of inflation shocks.
2. The unemployment rate.
3. Core inflation.
The second also includes three variables, but uses median inflation to capture underlying inflation and the V/U ratio to capture labour market slack:
i. The difference between headline and median inflation as a measure of shocks to headline inflation.
ii. The V/U ratio.
iii. Median inflation.
We then calculate how core and median inflation respond to shocks to headline inflation and to labour market slack.
System 1: core inflation and unemployment
We first study how core inflation responds to a shock to headline inflation and a fall in the unemployment rate. The left hand panel of Figure 4 shows the response of core inflation to headline inflation. The effect is only statistically significant for at most a year. Thus, after about a year the response is no longer significant at the 95% level.
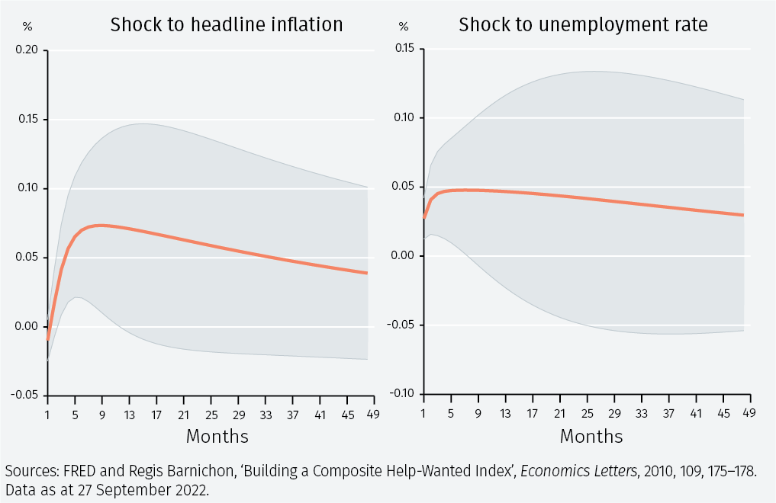
The right hand panel of Figure 4 shows the response of core inflation to a decline in the unemployment rate. In this case also, core inflation rises it is significant only for a short period of time.
Overall, these results suggest that it would be correct for the Fed not to worry excessively about the longer-run effects of the shocks to headline inflation and to movements in unemployment.
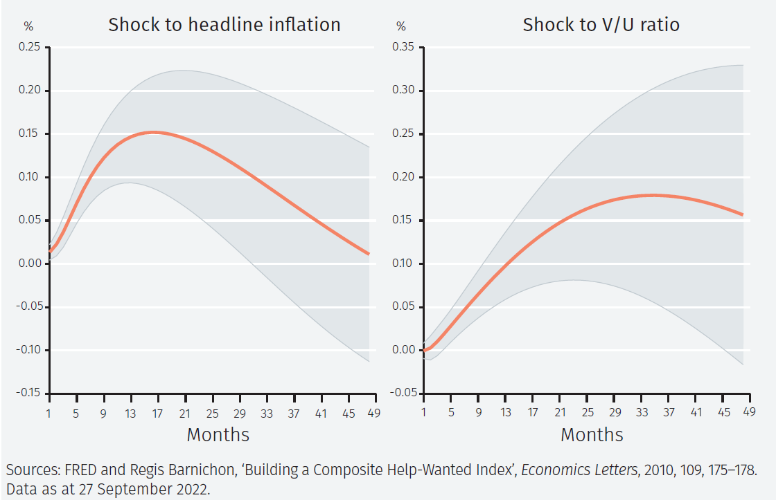
System 2: median inflation and the V/U ratio
Next, we turn to the system where median inflation is used to judge underlying inflation pressures and the V/U ratio to capture the state of the labour market. The results (see Figure 5) now show larger, longer lasting and more signficant responses. Thus, the responses in both cases are significant for about 30 months or 2½ years. These findings show that there is much more inflationary momentum in the economy than suggested by core inflation and the unemployment rate.
Conclusions
This analysis indicates that the focus on core inflation and unemployment, as opposed to median inflation and the V/U ratio, may have led the Fed and other forecasters to underestimate the extent and duration of the upward pressure on underlying inflation.
In turn, this suggests that it will be more difficult for the Fed to reduce inflation than it may have expected, and it will set higher interest rates and do so for longer than many observers may have believed based on traditional analysis. Market expectations that the Fed will continue to raise interest rates in the coming months but start cutting them soon are therefore likely to be misguided. It seems more likely that that once interest rates reach their peak level, the Fed will keep them unchanged for a year or so before starting to lower them.
1 See https://www.federalreserve.gov/monetarypolicy/fomccalendars.htm
2 https://www.brookings.edu/bpea-articles/understanding-u-s-inflation-during-the-covid-era/
3 Or, if the number of items is even, the average of the two in the middle.
4 The standard deviation of headline inflation in the graph is 1.6%, core inflation 1.1% and median inflation 0.8%.
5 The models are of VAR(2) type. Identification is achieved by ordering the variables as indicated in the text and using a Cholesky factorisation.
Important Information
The value of investments and the income derived from them can fall as well as rise, and past performance is no indicator of future performance. Investment products may be subject to investment risks involving, but not limited to, possible loss of all or part of the principal invested.
This document does not constitute and shall not be construed as a prospectus, advertisement, public offering or placement of, nor a recommendation to buy, sell, hold or solicit, any investment, security, other financial instrument or other product or service. It is not intended to be a final representation of the terms and conditions of any investment, security, other financial instrument or other product or service. This document is for general information only and is not intended as investment advice or any other specific recommendation as to any particular course of action or inaction. The information in this document does not take into account the specific investment objectives, financial situation or particular needs of the recipient. You should seek your own professional advice suitable to your particular circumstances prior to making any investment or if you are in doubt as to the information in this document.
Although information in this document has been obtained from sources believed to be reliable, no member of the EFG group represents or warrants its accuracy, and such information may be incomplete or condensed. Any opinions in this document are subject to change without notice. This document may contain personal opinions which do not necessarily reflect the position of any member of the EFG group. To the fullest extent permissible by law, no member of the EFG group shall be responsible for the consequences of any errors or omissions herein, or reliance upon any opinion or statement contained herein, and each member of the EFG group expressly disclaims any liability, including (without limitation) liability for incidental or consequential damages, arising from the same or resulting from any action or inaction on the part of the recipient in reliance on this document.
The availability of this document in any jurisdiction or country may be contrary to local law or regulation and persons who come into possession of this document should inform themselves of and observe any restrictions. This document may not be reproduced, disclosed or distributed (in whole or in part) to any other person without prior written permission from an authorised member of the EFG group.
This document has been produced by EFG Asset Management (UK) Limited for use by the EFG group and the worldwide subsidiaries and affiliates within the EFG group. EFG Asset Management (UK) Limited is authorised and regulated by the UK Financial Conduct Authority, registered no. 7389746. Registered address: EFG Asset Management (UK) Limited, Park House, 116 Park Street, London W1K 6AP, United Kingdom, telephone +44 (0)20 7491 9111.