- Date:
Infocus - Inflation has surged to levels not seen in decades due to rising commodity prices, supply chain bottlenecks and tight labour markets. These factors apply to most developed countries, but not to Switzerland where inflation remains low. In this edition of Infocus, GianLuigi Mandruzzato compares Swiss inflation to that in the US and the eurozone and draws some policy implications.
Inflation has surged to levels not seen in decades due to rising commodity prices, supply chain bottlenecks and tight labour markets. These factors apply to most developed countries, but not to Switzerland where inflation remains low. In this edition of Infocus, GianLuigi Mandruzzato compares Swiss inflation to that in the US and the eurozone and draws some policy implications.
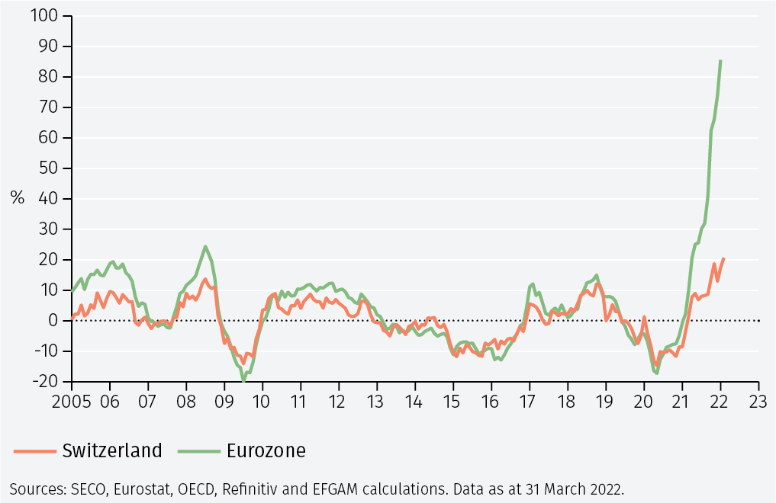
The median inflation rate across developed economies rose to 5.6% in February, a 5-percentage point increase from twelve months earlier. In absolute terms, inflation has returned to levels last seen several decades ago (see Figure 1). In the eurozone, inflation surged to 7.5% year-on-year in March. However, Switzerland is an exception; although higher than in the recent past, the inflation rate has risen only to 2.4% year-on-year in March.
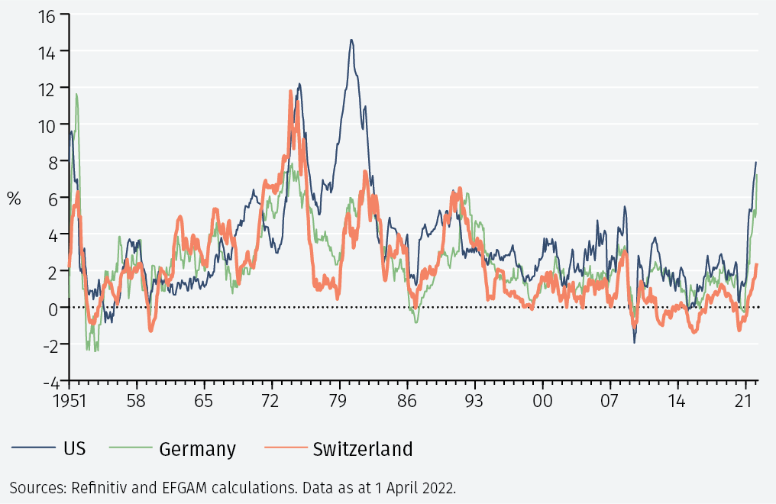
Figure 1 shows that since the mid-1970s inflation in Switzerland has been close to, but often slightly lower than in the US and Germany. The inflation gap in Switzerland’s favour has widened in recent years, following the eurozone debt crisis, and has surged in the past twelve months.
The CPI baskets are different
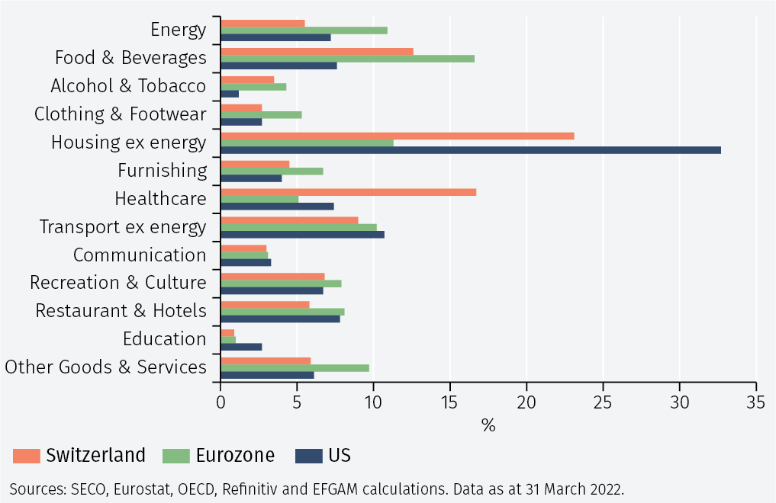
To understand why inflation is less affected in Switzerland than in other economies by shocks to commodity prices and supply chain bottlenecks, it is useful to consider the weight of the main expenditure items in the CPI basket.1 These reflect the spending patterns of households in the different economies. Figure 2 shows that the main differences between Switzerland, the eurozone and the US concern the energy, food, housing excluding energy, and healthcare components.
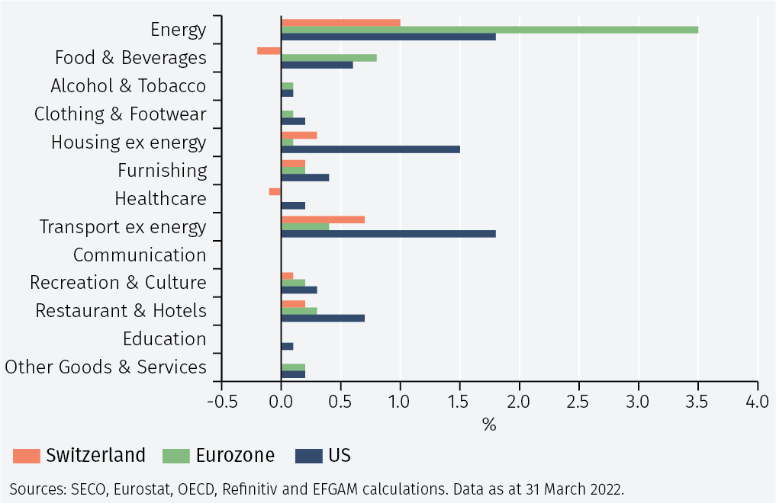
Figures 3a and 3b show the twelve-month changes in the price indices of the main components of the CPI and the contributions to the inflation rate in February.2 In all three countries, energy prices have increased the most. In Switzerland, however, the rise was less pronounced than elsewhere and combined with the lower weight of energy in the CPI basket, the contribution to inflation is 2.5 percentage points (pp) less than in the eurozone and 0.8 percentage points less than the US. The change in food prices, which also impacts restaurant prices, was also smaller in Switzerland than elsewhere, reducing Swiss inflation by 1.1pp compared to the eurozone and 1.3pp compared to the US.
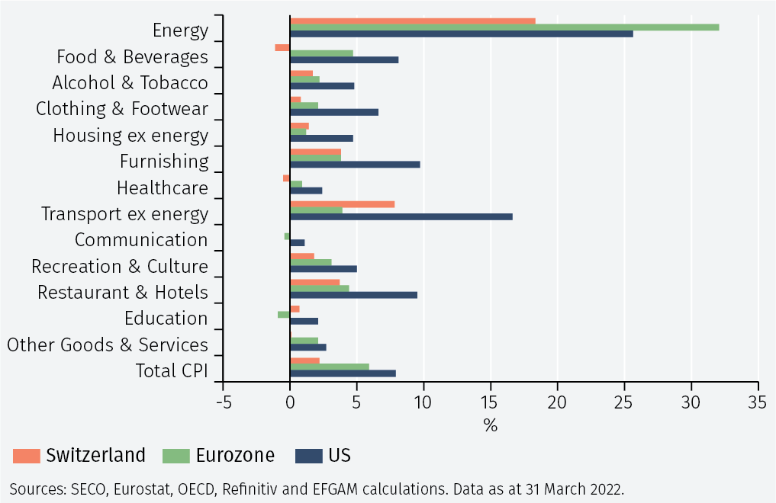
Overall, food and energy explain 95% of the inflation gap between Switzerland and the eurozone recorded in February and preliminary data for March show that share remained above 90% – and about 40% of the gap with the US.3
A closer look at energy prices
The evidence shows that energy prices are fundamental in explaining the differences in inflation, especially between Switzerland and the eurozone. This is almost totally due to differences in the price of electricity. In February and March, the price of electricity in Switzerland rose by only 2.4% yearon- year while in the eurozone it surged by 34.3% year-on-year in February and has likely risen further in March.4 The gap was even wider for producer prices of electricity: in February, the wholesale price of electricity in Switzerland was 3.1% higher than a year before, while in January in the eurozone the increase was as much as 83.2% year-on-year.
This gap reflects the different technologies used to produce electricity. According to data from the International Energy Agency, less than 1% of the electricity consumed in Switzerland comes from oil and natural gas, while 58% originates from hydroelectric and 34% from nuclear power. By comparison, in the European Union (EU) over one fifth of the electricity supplied is produced with natural gas and over one eighth with coal.
The prices of these commodities, which the EU imports mostly from Russia, have surged over the past 12 months, pushing up electricity prices in the EU. The gap in energy producer prices inflation between Switzerland and the eurozone has widened to unprecedented levels (see Figure 4). This is important because a shock to wholesale energy prices affects the production costs of goods and services in all sectors of the economy.
To understand the consequences of the shock to energy PPI, a model can be used to show how prices of services and nonenergy durable goods respond.5 The model shows that the cumulative transmission of a standard shock to energy PPI to the price of consumer services is statistically significant in both economies (see Appendix for impulse response charts). While in Switzerland the transmission of the shock is complete after three quarters, in the eurozone this happens only after eight quarters. Overall, the services CPI response in the eurozone is nearly three times larger than in Switzerland.
Furthermore, in Switzerland the impulse response of the durable goods CPI to a shock to energy PPI is not statistically significant. In contrast, in the eurozone the impulse response is statistically significant up to about six quarters after the shock.
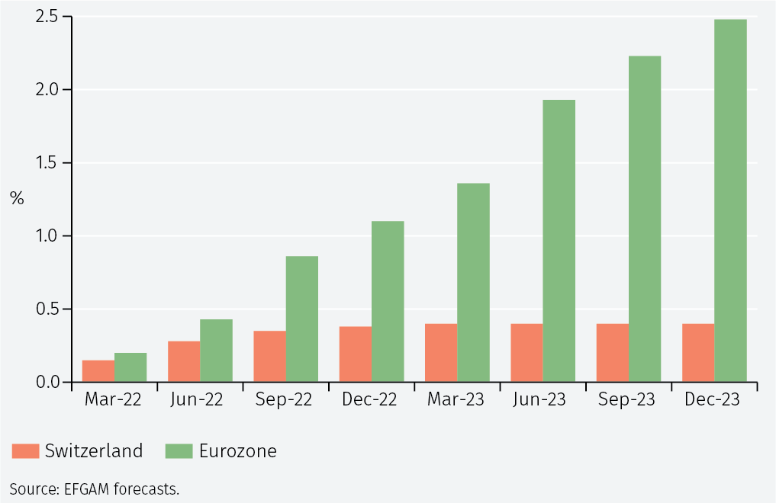
Between the spring of 2021 and the beginning of 2022, the energy PPI rose by about 15% in Switzerland and by almost 70% in the eurozone. In the absence of major changes in the energy PPI, the shock will increase future inflation in both economies up until the first part of 2023 (see Figure 5 overleaf). Barring expensive interventions by eurozone governments to sterilize the effects of the energy price shock for households and businesses, the impact will be much stronger in the eurozone, and inflation will rise much more than in Switzerland.
Conclusions and policy implications
The low inflation in Switzerland compared to other industrialised economies is largely explained by differences in the CPI baskets. Relative to the eurozone, the difference in electricity prices stands out.
Swiss electricity prices are unaffected by shocks to the prices of natural gas, coal and other fossil fuels which are still used to produce about 35% of the electricity consumed in the European Union. Conversely, in Switzerland 99% of electricity is produced with renewable sources or low-carbon emission technologies, including nuclear power.
Past increases in wholesale energy prices will push inflation higher in the coming quarters, but in Switzerland the effects will be contained and will not put undue pressure on the Swiss National Bank to normalise monetary policy regardless of the growth outlook.
In contrast, the European Central Bank runs the risk of facing an economic policy dilemma if inflation, already well above its 2% target, were to rise further or remain high for longer than currently expected. Indeed, the empirical analysis of the effects of changes in energy PPI on CPI inflation point to increased inflationary pressures in the next eighteen months.
Finally, the recent energy crisis triggered by Russia’s invasion of Ukraine and the sizeable impact this is having on consumer prices requires a policy response aimed at ensuring the safety, accessibility and affordability of energy sources. For Switzerland and even more so for the EU it is imperative to improve the energy efficiency of the economy and to support the development of both the most innovative renewable sources, including solar and wind power, and of those with low CO2 emissions.
1 For the US, the OECD reclassification of expenditure items according to the methodology followed in Europe is used.
2 February is the latest month for which detailed CPI data are available for the three economies.
3 Spending on housing and transportation net of energy explains much of the remaining difference in inflation between Switzerland and the US, suggesting a much greater impact on US consumer prices of global supply chain bottlenecks.
4 The prices of fuels for transportation and heating rose by about 30% year-on-year in both Switzerland and the eurozone. Both economies are almost fully dependent on imports for these goods, and local prices reflect developments in international commodity markets.
5 Two VAR models are estimated on energy PPI, and the CPI of services and non-energy durable consumer goods. The Swiss model is a VAR(1) and the eurozone model is a VAR(3). All variables are quarterly averages and the sample spans from 2005Q1 to 2021Q4. The correlation matrix of the model variables suggests that shocks to energy PPI come first, followed by that on services CPI and non-energy durable consumer goods CPI.
Important Information
The value of investments and the income derived from them can fall as well as rise, and past performance is no indicator of future performance. Investment products may be subject to investment risks involving, but not limited to, possible loss of all or part of the principal invested.
This document does not constitute and shall not be construed as a prospectus, advertisement, public offering or placement of, nor a recommendation to buy, sell, hold or solicit, any investment, security, other financial instrument or other product or service. It is not intended to be a final representation of the terms and conditions of any investment, security, other financial instrument or other product or service. This document is for general information only and is not intended as investment advice or any other specific recommendation as to any particular course of action or inaction. The information in this document does not take into account the specific investment objectives, financial situation or particular needs of the recipient. You should seek your own professional advice suitable to your particular circumstances prior to making any investment or if you are in doubt as to the information in this document.
Although information in this document has been obtained from sources believed to be reliable, no member of the EFG group represents or warrants its accuracy, and such information may be incomplete or condensed. Any opinions in this document are subject to change without notice. This document may contain personal opinions which do not necessarily reflect the position of any member of the EFG group. To the fullest extent permissible by law, no member of the EFG group shall be responsible for the consequences of any errors or omissions herein, or reliance upon any opinion or statement contained herein, and each member of the EFG group expressly disclaims any liability, including (without limitation) liability for incidental or consequential damages, arising from the same or resulting from any action or inaction on the part of the recipient in reliance on this document.
The availability of this document in any jurisdiction or country may be contrary to local law or regulation and persons who come into possession of this document should inform themselves of and observe any restrictions. This document may not be reproduced, disclosed or distributed (in whole or in part) to any other person without prior written permission from an authorised member of the EFG group.
This document has been produced by EFG Asset Management (UK) Limited for use by the EFG group and the worldwide subsidiaries and affiliates within the EFG group. EFG Asset Management (UK) Limited is authorised and regulated by the UK Financial Conduct Authority, registered no. 7389746. Registered address: EFG Asset Management (UK) Limited, Leconfield House, Curzon Street, London W1J 5JB, United Kingdom, telephone +44 (0)20 7491 9111.