- Date:
The recent burst of inflation in the US and in many other countries has led investors to wonder whether the entire inflation environment has changed.
Why do we invest in equities? A key reason is that equity investments compound over time. By investing $100 in a company that grows 10-15% per year for 20 years, that $100 turns into $673 at a 10% compound rate, or $1637 at a 15% compound rate. In comparison, a 3% bond would return $181 for the same period.
These 10-15% “compounders” are not as difficult to find as one might think, with many being household names: Google, Mastercard, and Louis Vuitton. We call them “secular growers” – high quality companies with favourable secular trends (digital advertising, cashless payment, and luxury democratisation respectively).
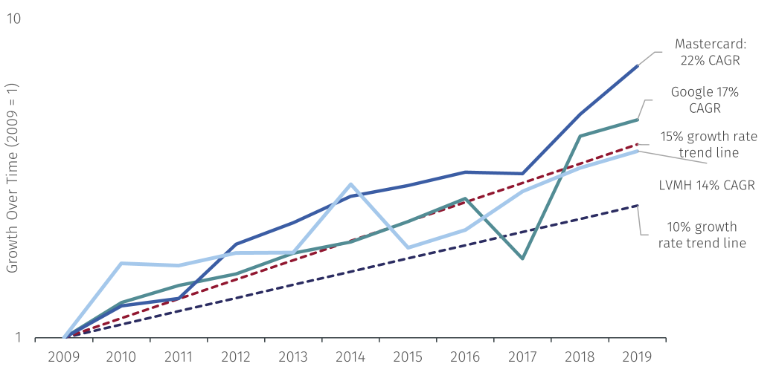
* Earnings per share (EPS) growth between 2009 and 2019, rebased to 2019. Google’s 2017 EPS was impacted by a one-off tax impact.
Past performance is not necessarily a guide to the future. Source: FactSet and EFGAM calculations.
This strategy has served many investors well over the decades. However, as “growth” stocks have underperformed the broader equity market more recently, one question emerges: is it the end of secular growth investing?
To answer this question, we examine the two main causes for the recent “growth” stocks’ underperformance:
1. Secular growth: paused or broken?
The Covid-19 pandemic accelerated some secular growth trends. One example is e-commerce. Before the pandemic, US e-commerce sales had been growing at over 9% per annum between 2009 and 2019. E-commerce penetrations (as a percentage of the total US retail sales) rose from 12.2% in 2009 to 20.8% by 2019, or roughly 0.9% increase per year. In 2020, e-commerce penetrations soared due to lockdowns: from 20.9% in December 2019 to 26.8% in April 2020 – pulling forward four years of e-commerce growth in just four months (Figure 2).
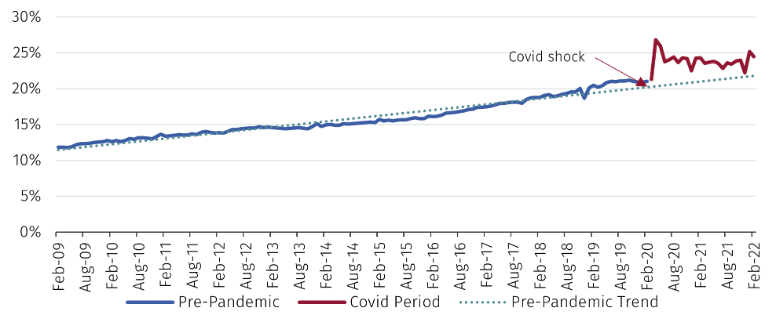
Source: U.S. Census Bureau and Wolfe Research.
Some of the pull-forward effect will stick – for example an octogenarian who learnt how to shop online in 2020 might continue to shop online in future. But in 2022 there is some normalisation between online and off-line shopping, as the world reopens.
This “pull-forward and pause” effect was evident in Amazon’s financial results. Amazon’s online stores sales year-on-year growth rate jumped from 24.3% in Q1 2020 to 47.8% in Q2 2020. The growth rate stayed around 40% for four quarters, before starting to moderate in 2021. Since Q3 2021, Amazon’s online sales have barely been growing at all.
We try to look through the Covid boost, by examining the 3-year period between 2019 and 2022. The annualised growth rate between 2019 and 2022 is around 20% - suggesting that secular growth remains healthy (Figure 3, red line). Indeed, Amazon’s year-on-year growth rate should recover to 15% by late 2022, according to FactSet consensus estimates, in-line with the long-term secular growth trend.
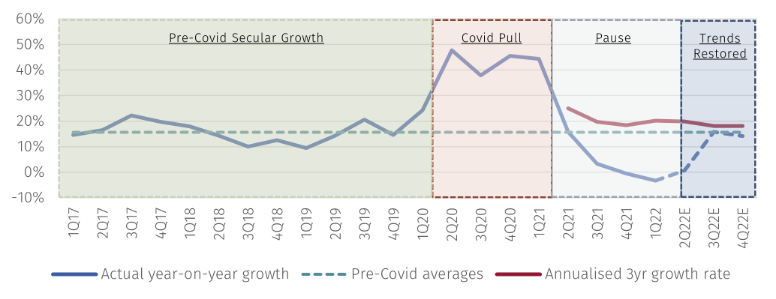
Source: FactSet and EFGAM calculations.
Similar patterns also occurred in connected TV (Netflix and Roku), social media (Facebook and Snapchat) and some software applications (Adobe and Asana). Almost anything with a screen attached.
2. Rising bond yields compress equity valuations
Not all secular growth stocks experienced the same Covid impact. For example, we look at Adyen, a modern merchant payment service provider.
Adyen’s revenue grew 28% in 2020. Despite a strong 2021 when its revenue grew 46%, Adyen is still expected to grow 39% in 2022. Further, consensus 2022 expectations, for revenue and profits (EBITDA), had not changed in the last six months between November 2021 and April 2022. Yet, Adyen’s share price dropped over -40% over the same period (Figure 4).
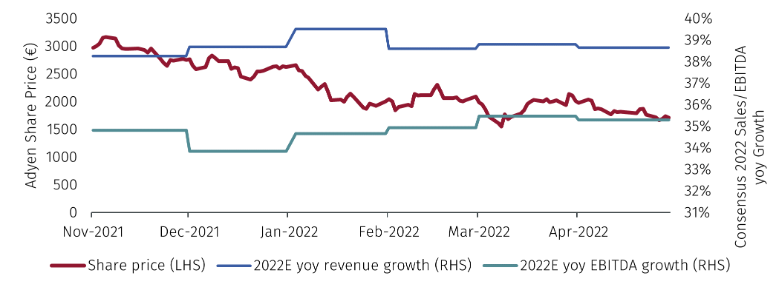
Past performance is not necessarily a guide to the future. Source: FactSet.
What happened? Valuation. Adyen’s valuation, in terms of the EV/EBITDA ratio, shrunk -46%, driving down the share price despite no changes to business fundamentals (Figure 5).
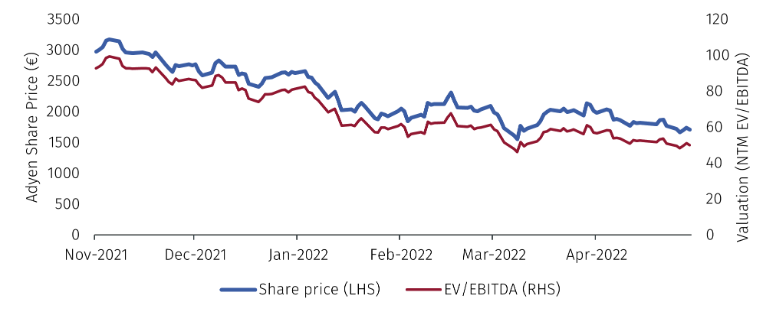
Past performance is not necessarily a guide to the future. Source: FactSet, including forward consensus estimates.
Inflation concern is the main reason for the valuation compression. Higher than expected inflation triggered fears that central banks would have to raise rates more aggressively than previously anticipated.
Higher rates hurt “growth” stocks more than “value” stocks. This is because when we value equities using Discount Cashflows, “growth” stocks’ cashflows are further in the future and therefore more sensitive to changes in discount rates. As illustrated in Figure 6, as the 30-year Treasury yield rose from 2.0% in November 2021 to 3.0% in April 2022, a “growth” stock’s valuation drops -30%, while a “value” stock’s valuation drops -15%.
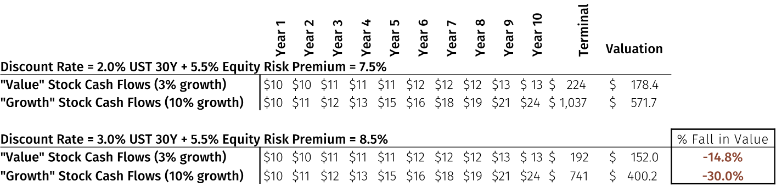
Source: FactSet, including forward consensus estimates.
In short, the combination of secular growth trends taking a pause and the valuation compression from rising rates, both occurred in late 2021, caused “growth” stocks to underperform.
Now, is this the end of secular growth investing? It is down to two factors:
1. Is the secular growth trend broken?
We must assess each individual secular trend carefully. Some growth trends could sustain (digital cloud adoption), some are taking a pause (e-commerce and connected TV), while some might revert back to 2019 (in-house fitness?).
Staying with our e-commerce example, the US e-commerce penetration was 24.5% in February 2022. In comparison, the Chinese e-commence penetration already reached 34.1% in 2019 and jumped to 52% in 2021, according to eMarketer. The US e-commerce penetration had been rising by 0.9% per year in 2009-2019. If a similar adoption trend continues from 2022, the US e-commerce could continue to grow for at least 10 more years, before reaching China’s 2019 levels (Figure 7).
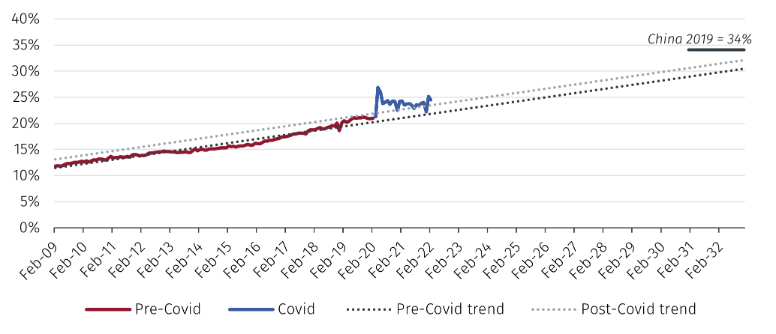
Source: U.S. Census Bureau, Wolfe Research and eMarketer
2. Is valuation sensible?
It’s difficult to be definitive in absolute terms, but relative valuations are certainly becoming interesting.
Which of the following companies would you prefer to own for 5 years: A or B, and C or D?
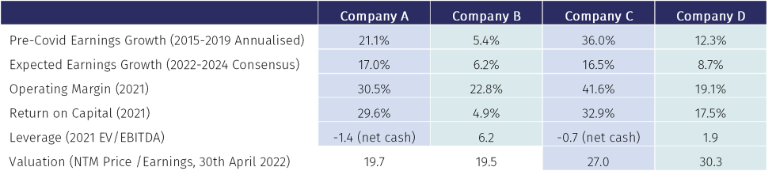
Past performance is not necessarily a guide to the future. Source: FactSet
Solely looking at the numbers, most would prefer Company A to Company B, and Company C to Company D. A and C have far superior financial metrics, despite trading at similar valuations to B and D.
Company A is Google, B is Duke Energy (electric utilities), Company C is Microsoft and Company D is General Mills (food staples). In a volatile environment, “value” stocks, such as Duke Energy and General Mills, are in favour due to safe-haven status. These stocks may deserve some capital allocation currently. But over a longer time-horizon, it’s secular growers like Google and Microsoft that deliver strong returns to patient investors.
To conclude, the underperformance of secular growth stocks since November 2021 can be attributed to a combination of 1) secular growth taking a pause to digest covid gains; and 2) rising bond yields compressing equity valuations. Now, the questions for secular growth investors to figure out are: 1) are long-term secular growth trends intact or broken; and 2) is the valuation reasonable? If both answers are yes, then secular growth investing should continue to deliver long-term gains.
Important Information
The value of investments and the income derived from them can fall as well as rise, and past performance is no indicator of future performance. Investment products may be subject to investment risks involving, but not limited to, possible loss of all or part of the principal invested.
Hypothetical performance results have many inherent limitations. No representation is being made that any account will or is likely to achieve profits or losses similar to those shown; in fact, there are frequently sharp differences between hypothetical performance results and the actual results subsequently achieved by any particular trading program. One of the limitations of hypothetical performance results is that they are generally prepared with the benefit of hindsight. In addition, hypothetical trading does not involve financial risk, and no hypothetical trading record can completely account for the impact of financial risk of actual trading. For example, the ability to withstand losses or adhere to a particular trading program in spite of trading losses are material points which can also adversely affect actual trading results. There are numerous other factors related to the markets in general or to the implementation of any specific trading program which cannot be fully accounted for in the preparation of hypothetical performance results and all which can adversely affect trading results.
This document does not constitute and shall not be construed as a prospectus, advertisement, public offering or placement of, nor a recommendation to buy, sell, hold or solicit, any investment, security, other financial instrument or other product or service. It is not intended to be a final representation of the terms and conditions of any investment, security, other financial instrument or other product or service. This document is for general information only and is not intended as investment advice or any other specific recommendation as to any particular course of action or inaction. The information in this document does not take into account the specific investment objectives, financial situation or particular needs of the recipient. You should seek your own professional advice suitable to your particular circumstances prior to making any investment or if you are in doubt as to the information in this document.
Although information in this document has been obtained from sources believed to be reliable, no member of the EFG group represents or warrants its accuracy, and such information may be incomplete or condensed. Any opinions in this document are subject to change without notice. This document may contain personal opinions which do not necessarily reflect the position of any member of the EFG group. To the fullest extent permissible by law, no member of the EFG group shall be responsible for the consequences of any errors or omissions herein, or reliance upon any opinion or statement contained herein, and each member of the EFG group expressly disclaims any liability, including (without limitation) liability for incidental or consequential damages, arising from the same or resulting from any action or inaction on the part of the recipient in reliance on this document.
The availability of this document in any jurisdiction or country may be contrary to local law or regulation and persons who come into possession of this document should inform themselves of and observe any restrictions. This document may not be reproduced, disclosed or distributed (in whole or in part) to any other person without prior written permission from an authorised member of the EFG group.
This document has been produced by EFG Asset Management (UK) Limited for use by the EFG group and the worldwide subsidiaries and affiliates within the EFG group. EFG Asset Management (UK) Limited is authorised and regulated by the UK Financial Conduct Authority, registered no. 7389746. Registered address: EFG Asset Management (UK) Limited, ParkHouse, 116 Park Street, London W1K 6AP, United Kingdom, telephone +44 (0)20 7491 9111.