- Date:
- Author:
- Sam Jochim
Infocus - Inflation has surged to levels not seen in decades due to rising commodity prices, supply chain bottlenecks and tight labour markets. These factors apply to most developed countries, but not to Switzerland where inflation remains low. In this edition of Infocus, GianLuigi Mandruzzato compares Swiss inflation to that in the US and the eurozone and draws some policy implications.
Recent economic data in China have been weaker than expected. This softening momentum will likely lead to policy stimulus. However, solving structural issues will be crucial for its economy in the years ahead. In this edition of Infocus, Economist Sam Jochim summarises what can be expected from China in 2023 and the long-term challenges.
Softening momentum
Recent data in China have been weaker than expected. Retail sales growth slowed from 18.4% year-on-year in April to 12.7% in May (see Figure 1). While these numbers appear strong, they reflect a favourable base effect due to the Shanghai lockdown in 2022. Looking at the data in year-on-year terms can be misleading. Corrected for seasonal effects, retail sales rose 0.2% and 0.4% month-on-month in April and May.
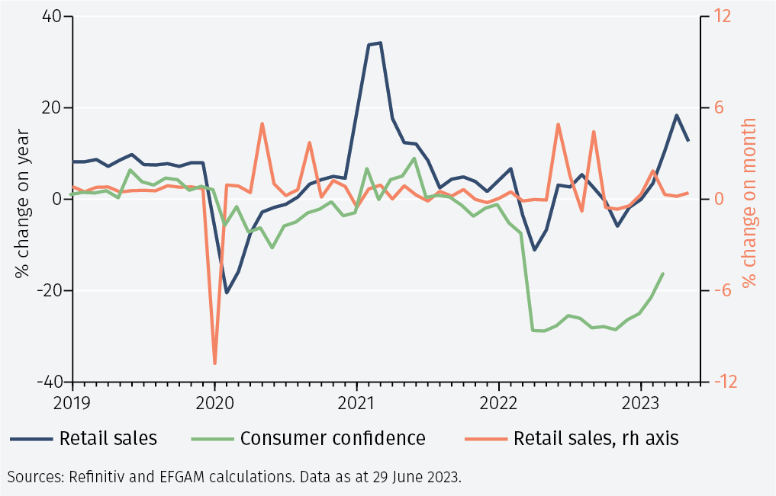
While recent data have been softening, month-on-month retail sales have averaged 0.63% so far in 2023, in line with the 2018 average of 0.65%. In 2018, GDP growth in China was 6.7%. This emphasises a key point. Though data in recent months have slowed, the recovery in China year-to-date appears to be consistent with the 5% GDP growth target.
What will worry Beijing is that consumer confidence remains weak. Deposits held by Chinese households grew by USD 2.6 trillion in 2022, the largest rise on record and equivalent to around 14% of China’s GDP.1 President Xi would have hoped that this translated into stronger household spending in 2023, but low consumer confidence remains a constraint on this.
A notable trend within retail sales data has been that catering sales, a proxy for dining out and the only services element within the data, have been strong in 2023, while sales of goods have been weaker.2 According to S&P Global PMI data, the services sector in China has been stronger than the manufacturing sector in 2023 (see Figure 2). Given that 27% of Chinese GDP growth in 2021 was attributed to manufacturing, softness in that sector has more of an impact on GDP growth than, for example, the US where manufacturing accounted for just 11% of GDP growth in 2021.3
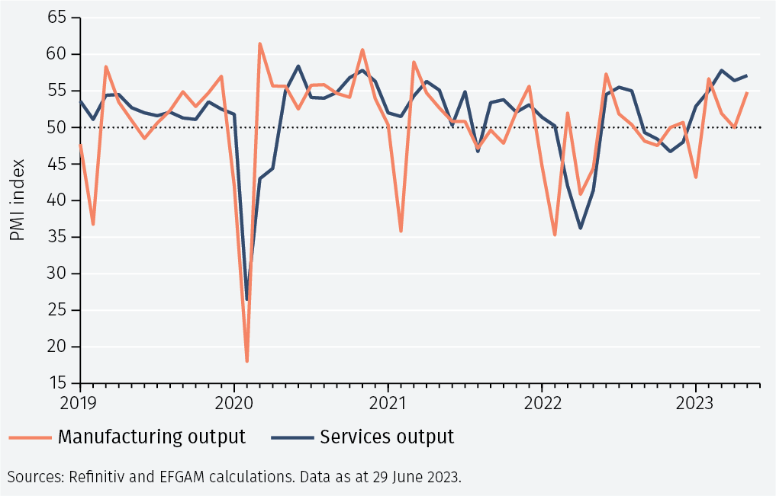
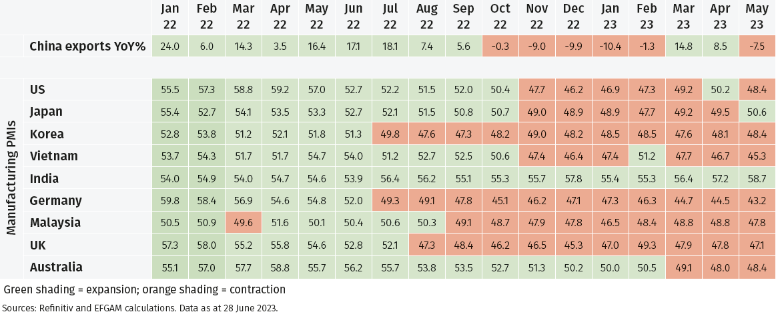
Although China’s manufacturing PMI remains in expansion territory, it is notable that it remains below that of the services PMI. The disparity between services and manufacturing sectors globally could be important for the contribution of exports to GDP growth in China. In 2022, China’s main exports were automatic data processing equipment and integrated circuits.4 Nine of the top ten export destinations for China for which manufacturing PMIs are available have seen manufacturing contract for most of 2023 (see Figure 3).5
Structural challenges
The deleveraging of the real estate sector represents one of the most prominent challenges to GDP growth in 2023 for China. The Government Work Report in March highlighted the intention to prevent unregulated expansion of the sector. In line with this, the quota for special local government bonds was set at RMB 3.8 trillion (USD 526 billion) in 2023, below the RMB 4.2 trillion (USD 582 billion) actual issuance in 2022.6
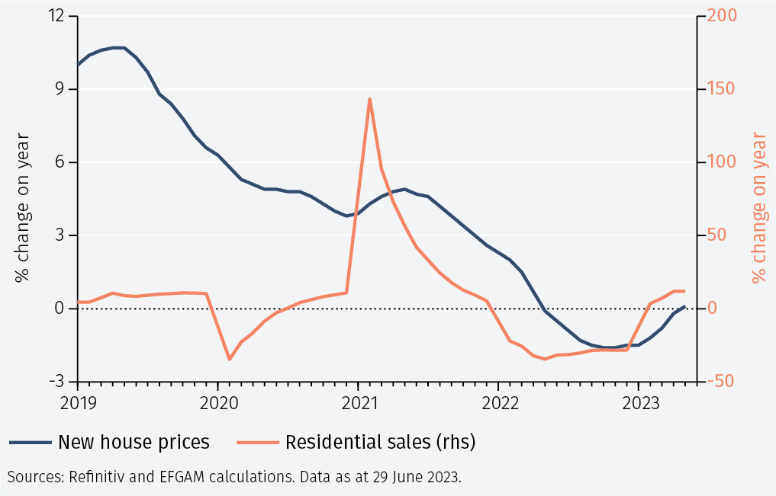
Despite this, residential real estate is tentatively recovering in 2023, with new house prices turning positive in year-on-year terms in May and residential sales having done so in February (see Figure 4). Given real estate accounts for around 70% of household wealth in China, this could have positive implications for consumer spending via the wealth effect.7
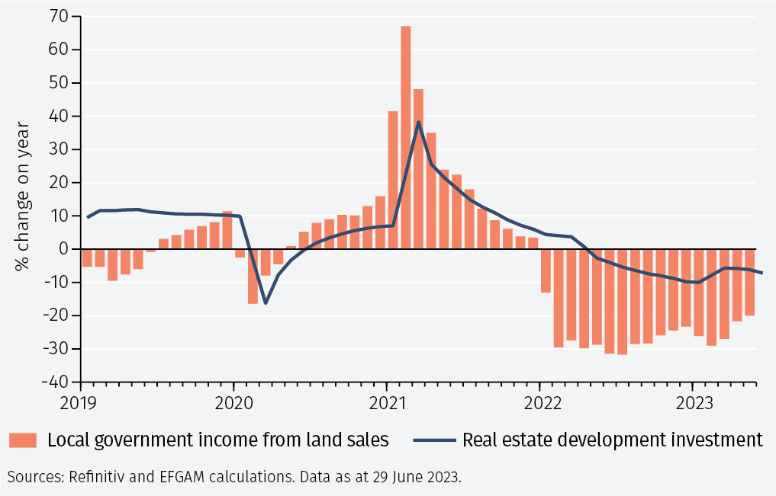
However, it is also of note that real estate investment remains in decline (see Figure 5). While this may reflect the reduced financing provided to local governments by Beijing, it is likely also to be a result of reduced income from land sales and high debt levels. Sales of land use rights is the largest source of non-tax revenue for local governments, which are facing RMB 65.7 trillion (USD 5.1 trillion) in total debt with RMB 5 trillion (USD 693 billion) maturing in 2023.8
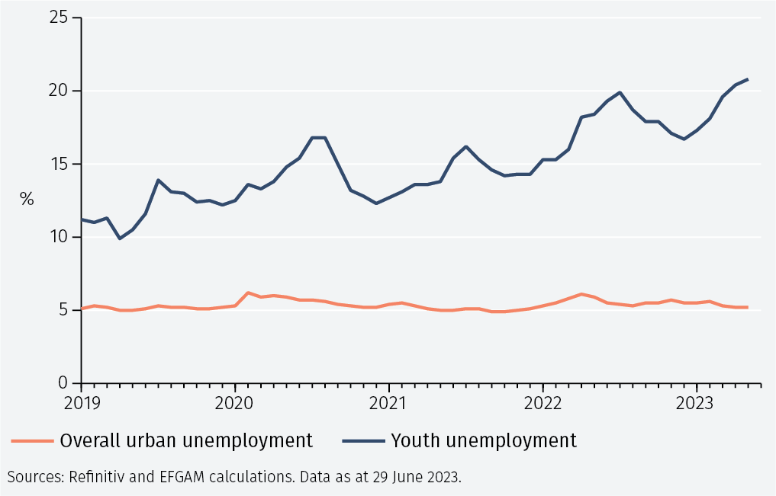
China maintained a low unemployment rate during the pandemic, despite its zero-Covid policy dampening economic activity. The overall urban unemployment rate remained between 4.9% and 6.2% from 2019 to 2022 and was 5.2% in May 2023. For those aged 16-24, the labour market is currently more challenging. Youth unemployment rose to a record high in May of 20.8% (see Figure 6). Despite an announcement in March that state-owned enterprises would create 1 million internships for graduates, the fact that 11.6 million students will graduate in 2023 means youth unemployment is likely to continue to rise.9
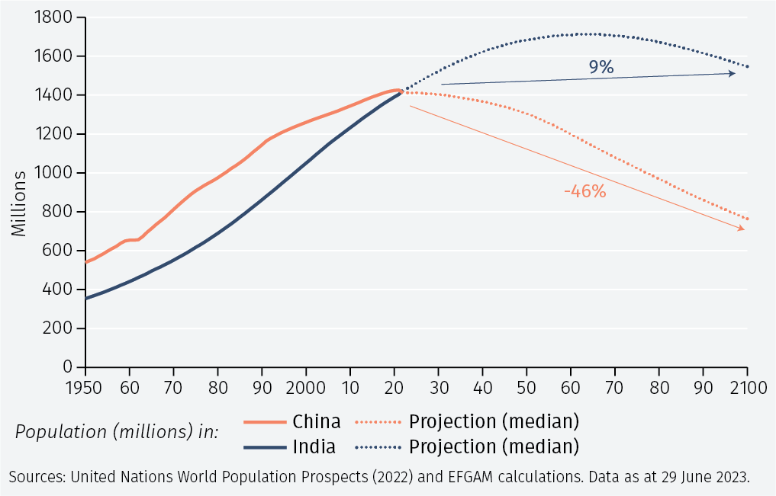
While this is a structural issue that will require attention from Beijing, the largest constraint on future GDP growth appears to be China’s shrinking population. According to projections from the United Nations, China’s population will be around 46% smaller than it is today by 2100. This compares to an estimated 9% increase in the population of India, for example (see Figure 7).
Short-term stimulus
The People’s Bank of China (PBoC) cut the 1-year and 5-year loan prime rates by 10 basis points in June, following moves of the same magnitude for some short- and medium-term lending facility rates. A rate cut of this magnitude is unlikely to have a large impact on economic activity and should be viewed as a signal rather than material monetary easing.
Further stimulus is more likely to come in the form of fiscal measures. Indeed, following a meeting in June, the State Council released a statement noting “more forceful measures are coming”.10
It is difficult to assess the economic impact of fiscal stimulus before knowing its magnitude and what it will be used for. Given the declines in infrastructure investment and the high debt levels of local governments, it is plausible that special Treasury bonds are issued by Beijing to be made available to local governments to focus on infrastructure spending. This was the mechanism used in 2020 to fund pandemic and infrastructure spending.
Unlike special local government bonds, special Treasury bonds are not included in the official deficit target, meaning this stimulus would go beyond what was announced for the year following the Two Sessions meetings. It is likely that the measure aims at moderating the deleveraging in the real estate sector rather than boosting leverage. In other words, it makes it easier for local governments to maintain current levels of infrastructure investment and to pay maturing debt.
This means that the actual boost to growth is unlikely to be large. Rather, policy is best seen as a means of mitigating against downside risks to economic momentum. It should also be noted that base effects in Q2 and Q4 will boost year-onyear GDP growth for the whole of 2023. For example, in Q2 2022 China’s GDP contracted by 2.3% quarter-on-quarter. This means that even if the quarter-on-quarter growth rate in Q2 2023 is 0%, year-on-year GDP growth would rise to around 7% from 4.5% in Q1.11
Conclusion
Although momentum in economic data in China is softening, GDP growth remains in line with the 5% target set for 2023. As such, Beijing is likely to provide fiscal stimulus only to prevent further loss of momentum and it is unlikely to be large enough to provide a significant boost to economic activity. Stimulus is likely to focus on funding for local governments to limit the downside to infrastructure investment but should also consider other issues such as weak goods sales and high youth unemployment. Beyond 2023, China faces many structural challenges, not least its shrinking population, having now been overtaken by India as the most populous country in the world.
1 https://www.ft.com/content/2c066d1c-11a8-455a-8a9f-31f3d3d46b99 . Also, note that EFGAM calculations are based on 2022 GDP data from the IMF.
2 Catering sales rose 43.8% and 35.1% year-on-year in April and May respectively, compared to an increase of 15.9% and 10.5% respectively for goods sales.
3 Based on World Bank data, see https://data.worldbank.org/indicator/NV.IND.MANF.ZS
4 Based on data from China’s General Administration of Customs.
5 Top export destinations based on 2022 data from China’s General Administration of Customs. Hong Kong and Singapore excluded due to missing PMI data.
6 See EFGAM Macro Flash Note, China: The Two Sessions and beyond (March 2023). Also, note that special local government bonds are a type of government debt issued in China to fund infrastructure projects
7 See The Economist, https://www.economist.com/finance-and-economics/2022/09/12/chinas-ponzi-like-property-market-is-eroding-faith-in-the-government
8 See Nikkei Asia, https://asia.nikkei.com/Spotlight/Caixin/China-s-plunging-land-sales-threaten-local-governments See also, IMF 2022 Article IV Consultation ‘People’s Republic of China’, https://tinyurl.com/52r6daw3 and https://www.reuters.com/world/china/debt-laden-local-governments-pose-fresh-challenges-chinas-growth-financial-2023-03-10/
9 Source: Ministry of Human Resources and Social Security of the People’s Republic of China. See also https://www.theguardian.com/world/2023/jun/01/china-graduates-jobs-market-youth-unemployment
10 Quote from Li Qiang following State Council meeting on 16 June 2023.
11 EFGAM calculations based on data from Refinitiv. Data as at 29 June 2023.
Important Information
The value of investments and the income derived from them can fall as well as rise, and past performance is no indicator of future performance. Investment products may be subject to investment risks involving, but not limited to, possible loss of all or part of the principal invested.
This document does not constitute and shall not be construed as a prospectus, advertisement, public offering or placement of, nor a recommendation to buy, sell, hold or solicit, any investment, security, other financial instrument or other product or service. It is not intended to be a final representation of the terms and conditions of any investment, security, other financial instrument or other product or service. This document is for general information only and is not intended as investment advice or any other specific recommendation as to any particular course of action or inaction. The information in this document does not take into account the specific investment objectives, financial situation or particular needs of the recipient. You should seek your own professional advice suitable to your particular circumstances prior to making any investment or if you are in doubt as to the information in this document.
Although information in this document has been obtained from sources believed to be reliable, no member of the EFG group represents or warrants its accuracy, and such information may be incomplete or condensed. Any opinions in this document are subject to change without notice. This document may contain personal opinions which do not necessarily reflect the position of any member of the EFG group. To the fullest extent permissible by law, no member of the EFG group shall be responsible for the consequences of any errors or omissions herein, or reliance upon any opinion or statement contained herein, and each member of the EFG group expressly disclaims any liability, including (without limitation) liability for incidental or consequential damages, arising from the same or resulting from any action or inaction on the part of the recipient in reliance on this document.
The availability of this document in any jurisdiction or country may be contrary to local law or regulation and persons who come into possession of this document should inform themselves of and observe any restrictions. This document may not be reproduced, disclosed or distributed (in whole or in part) to any other person without prior written permission from an authorised member of the EFG group.
This document has been produced by EFG Asset Management (UK) Limited for use by the EFG group and the worldwide subsidiaries and affiliates within the EFG group. EFG Asset Management (UK) Limited is authorised and regulated by the UK Financial Conduct Authority, registered no. 7389746. Registered address: EFG Asset Management (UK) Limited, Park House, 116 Park Street, London W1K 6AP, United Kingdom, telephone +44 (0)20 7491 9111.