- Date:
- Author:
- Sam Jochim
Infocus - Inflation has surged to levels not seen in decades due to rising commodity prices, supply chain bottlenecks and tight labour markets. These factors apply to most developed countries, but not to Switzerland where inflation remains low. In this edition of Infocus, GianLuigi Mandruzzato compares Swiss inflation to that in the US and the eurozone and draws some policy implications.
Following the Global Financial Crisis (GFC), volatility in US equity markets declined, encouraged lower by falling interest rates and the Fed’s quantitative easing program. With the Fed having raised rates by a cumulative 525 basis points since March 2022 and now shrinking its balance sheet, could equity market volatility rise? In this edition of Infocus, Economist Sam Jochim investigates.
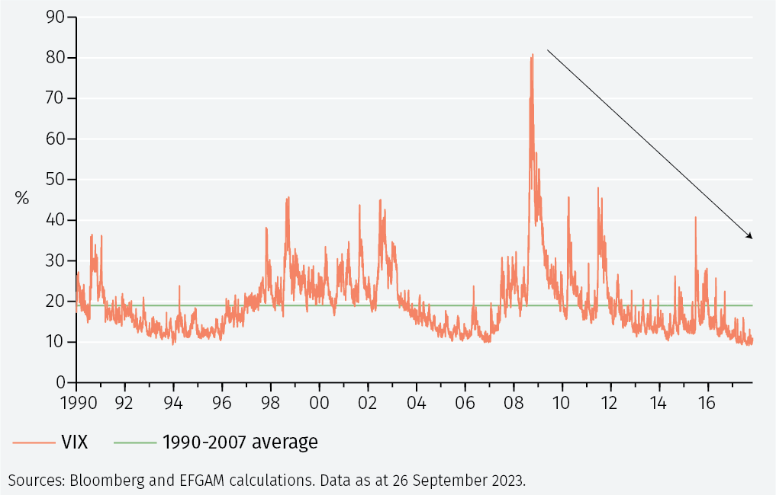
The Chicago Board Options Exchange’s Volatility Index, also known as the VIX, is designed to produce a measure of constant, 30-day expected (implied) volatility of the S&P 500 equity market. It does so by aggregating a range of put and call option prices into a single number.1
Also known as the ‘fear index’, the VIX spiked in 2008 due to the GFC (see Figure 1). Since then, it has followed a declining trend, apart from some event-specific spikes. Between January 2013 and December 2017, the VIX averaged 14.8, below its pre-GFC average of 18.9. Furthermore, in May 2017 the ‘fear index’ closed at its lowest level since December 1993.
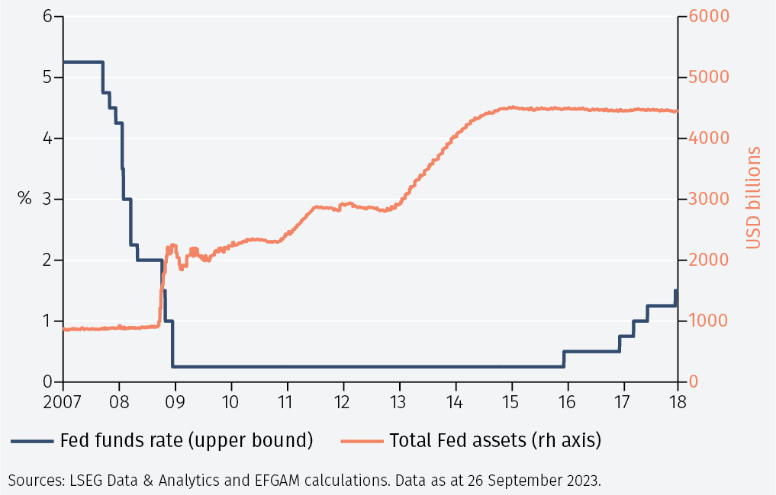
One of the notable legacies of the GFC was the rapid shift to unorthodox monetary policy by the Fed and other central banks. From September 2007 to December 2008, the US central bank cut interest rates by a cumulative 500 basis points. It also began purchasing longer dated Treasury bonds and mortgage backed securities, massively increasing its balance sheet as part of its quantitative easing (QE) strategy (see Figure 2).
Unorthodox monetary policy is often cited as a possible cause for the decline in the VIX following the GFC.2 In the US, it is also thought that QE has a larger impact on volatility than conventional monetary policy.3
One mechanism through which expansionary monetary policy could have reduced volatility following the GFC is by lowering bond yields. As Treasury yields fall, the risk-free rate of return declines, and investors look elsewhere for returns. One way to do this is to write – or sell – options. Writing options generates premium and is a manifestation of the search for income in a low yield environment. As incrementally more options are written, there is an increased supply of implied volatility to the market, pushing it and the VIX lower.
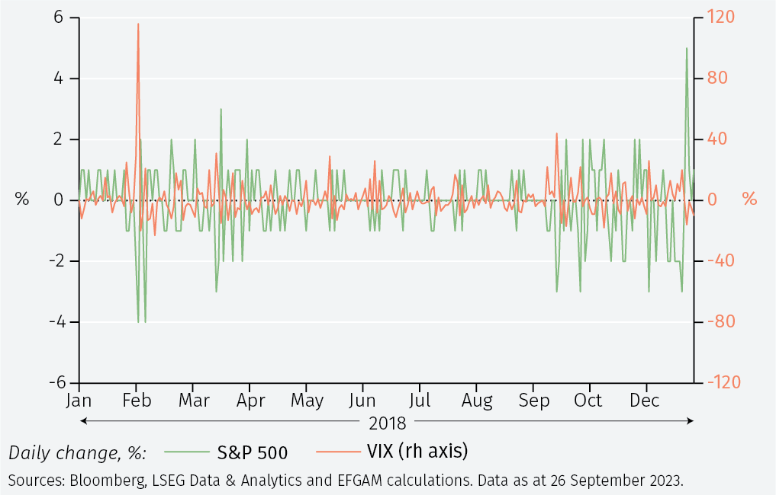
Furthermore, as low market volatility persisted, short volatility products became increasingly popular. Investors sold implied volatility, taking the view that market conditions would remain benign. However, as volatility fell to near record lows in late 2017, volatility markets became crowded and vulnerable to a rapid repricing.4 On 5 February 2018, the S&P 500 fell 4.1% and the VIX more than doubled in one day (see Figure 3). With many short volatility products losing up to 80% of their value in a single day, this event became known as Volmageddon.5
Since the start of 2019, the VIX has averaged around 22, slightly above its pre-GFC average. However, this period includes a global pandemic and the start of the first war in Europe since World War Two. So far in 2023, the ‘fear index’ has averaged 17.6, slightly below its pre-GFC average.
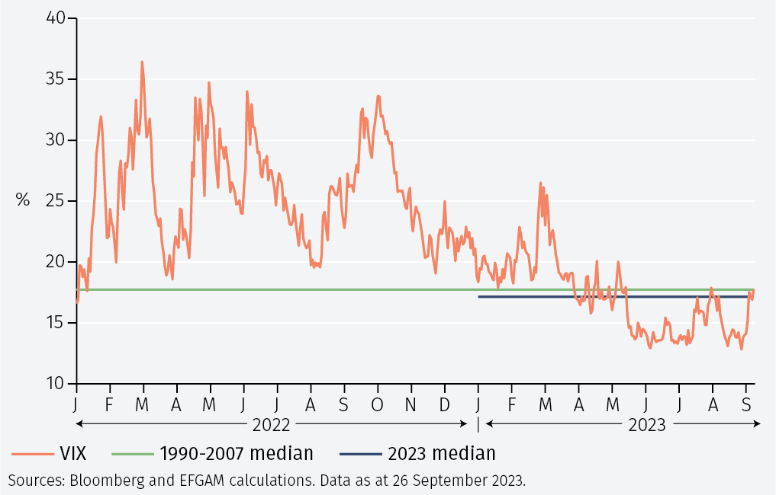
It is important to note that for much of the time the VIX lies below its long-run average; implied volatility is skewed to the right. In other words, large spikes in volatility caused by tensions such as the first Iraq war in 1990 and 9/11 in 2001 raise the long-run average. In the absence of such tensions, implied volatility is below its long-run average for much of the time.
One way to account for this is to look at the median value of the VIX. Since 1990, the VIX has closed below its pre-GFC average 56.1% of the time while it has closed below its pre-GFC median value 49.6% of the time. The median value of the VIX in 2023 has been slightly below its pre-GFC median level (see Figure 4).
That expansionary monetary policy reduced implied volatility following the GFC raises an interesting question in the current context: will the return to a more normal policy environment lead to a rise in implied volatility?
Since QE had a larger impact on volatility than conventional monetary policy in the US, the speed at which the Fed reduces its balance sheet may be more important for future volatility than the level of interest rates. This could provide an explanation as to why implied volatility has remained below its pre-GFC average and median so far in 2023, despite interest rates being increased to pre-GFC levels. The moderation in the Fed’s balance sheet has been milder by comparison.
It is difficult to assess the possible impact of a return to conventional monetary policy without holding an opinion on the level at which interest rates will eventually settle in the US, and the extent to which the Fed will reduce its balance sheet. Nonetheless, a possible rise in implied volatility could be an important consequence.
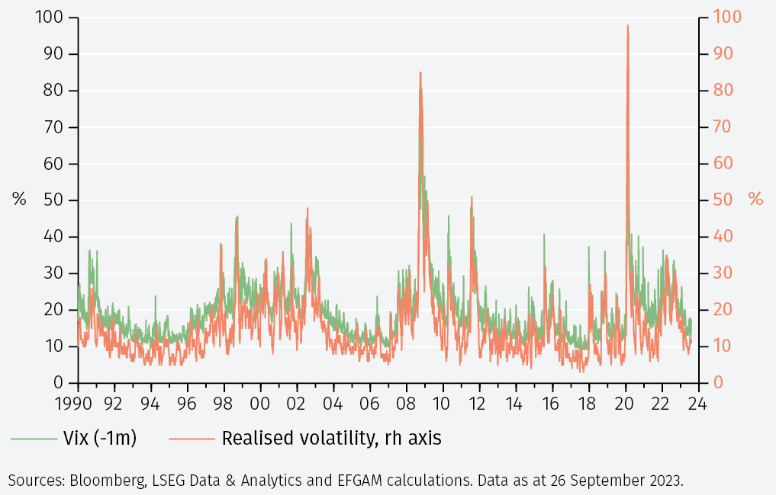
It is also interesting to compare implied volatility to realised volatility i.e., the market’s estimate of future volatility versus actual historical volatility (see Figure 5). Since the VIX measures implied volatility for the next month, it is shown with a one-month lag in Figure 5. Notably, implied volatility, as shown by the VIX, tends to trade above realised volatility. This can be viewed as the volatility risk premium. From January 1990 to August 2023 the VIX has traded an average of 1.45 times higher than the following month’s realised volatility. Furthermore, the two measures have a correlation of 73%, highlighting that implied volatility is a good proxy for realised volatility.
In summary, the Fed’s shift to expansionary monetary policy following the GFC played a role in the subsequent decline in US equity market volatility from 2013 to 2017. In 2023, the VIX has mostly traded below its pre-GFC average and median. With interest rates having been raised to pre-2008 levels and, perhaps more importantly, the Fed reducing its balance sheet, a rise in US equity market volatility is feasible.
1 https://www.cboe.com/tradable_products/vix/
2 The VIX, the variance premium and stock market volatility’, Bekaert, G. and Hoerova, M. (2014), Working Paper Series 1675. https://www.ecb.europa.eu/pub/pdf/scpwps/ecbwp1675.pdf
3 ‘Financial effects of QE and conventional monetary policy compared’, Weale, M. and Wieladek, T. (2022), Journal of International Money and Finance. https://doi.org/10.1016/j.jimonfin.2022.102673
4 ‘Volmageddon and the Failure of Short Volatility Products’, Financial Analysts Journal. Augustin, P., Cheng, I. and Van den Bergen, L. (2021). http://dx.doi.org/10.2139/ssrn.3819342
5 Chaos Kings: How Wall Street Traders Make Billions in the New Age of Crisis, Patterson, S. (2023). https://tinyurl.com/yc5uey6y
Important Information
The value of investments and the income derived from them can fall as well as rise, and past performance is no indicator of future performance. Investment products may be subject to investment risks involving, but not limited to, possible loss of all or part of the principal invested.
This document does not constitute and shall not be construed as a prospectus, advertisement, public offering or placement of, nor a recommendation to buy, sell, hold or solicit, any investment, security, other financial instrument or other product or service. It is not intended to be a final representation of the terms and conditions of any investment, security, other financial instrument or other product or service. This document is for general information only and is not intended as investment advice or any other specific recommendation as to any particular course of action or inaction. The information in this document does not take into account the specific investment objectives, financial situation or particular needs of the recipient. You should seek your own professional advice suitable to your particular circumstances prior to making any investment or if you are in doubt as to the information in this document.
Although information in this document has been obtained from sources believed to be reliable, no member of the EFG group represents or warrants its accuracy, and such information may be incomplete or condensed. Any opinions in this document are subject to change without notice. This document may contain personal opinions which do not necessarily reflect the position of any member of the EFG group. To the fullest extent permissible by law, no member of the EFG group shall be responsible for the consequences of any errors or omissions herein, or reliance upon any opinion or statement contained herein, and each member of the EFG group expressly disclaims any liability, including (without limitation) liability for incidental or consequential damages, arising from the same or resulting from any action or inaction on the part of the recipient in reliance on this document.
The availability of this document in any jurisdiction or country may be contrary to local law or regulation and persons who come into possession of this document should inform themselves of and observe any restrictions. This document may not be reproduced, disclosed or distributed (in whole or in part) to any other person without prior written permission from an authorised member of the EFG group.
This document has been produced by EFG Asset Management (UK) Limited for use by the EFG group and the worldwide subsidiaries and affiliates within the EFG group. EFG Asset Management (UK) Limited is authorised and regulated by the UK Financial Conduct Authority, registered no. 7389746. Registered address: EFG Asset Management (UK) Limited, Park House, 116 Park Street, London W1K 6AP, United Kingdom, telephone +44 (0)20 7491 9111.