- Date:
- Author:
- Sam Jochim
Infocus - Inflation has surged to levels not seen in decades due to rising commodity prices, supply chain bottlenecks and tight labour markets. These factors apply to most developed countries, but not to Switzerland where inflation remains low. In this edition of Infocus, GianLuigi Mandruzzato compares Swiss inflation to that in the US and the eurozone and draws some policy implications.
Core inflation in Japan reached a 41-year high in December yet the Bank of Japan (BoJ) left interest rates unchanged at its meeting on 18 January. In this edition of Infocus, Sam Jochim analyses Japanese inflation dynamics and whether the BoJ’s monetary policy stance is justified.
The most recent inflation release from Japan showed both headline and core inflation (which excludes fresh food but includes energy) rose 4.0% year-on-year (YoY) in December, surpassing the BoJ’s 2% target for the ninth consecutive month (see Figure 11). A large part of this increase reflected higher energy prices, which rose 15.2% YoY. Excluding energy and fresh food, core-core inflation rose 3.0% YoY in December, a pace not seen since August 1991.
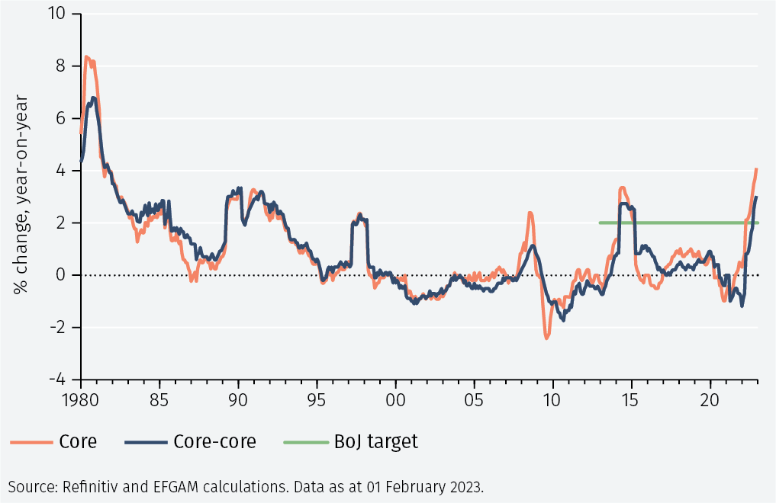
Perhaps the most interesting development, however, was the large discrepancy between goods (7.1% YoY) and services (0.8% YoY) inflation. Goods inflation includes energy, which has a weight of 14.1% within the goods basket and contributed 2.1% to its inflation in December. Excluding energy, goods inflation still exceeded that of services by 4.2%.
One potential explanation for the discrepancy is that the current surge in goods inflation largely reflects supply side factors. The BoJ shares this view, noting in its most recent meeting that it expects inflation to be relatively high in the short run due to the “pass-through to consumer prices of cost increases led by a rise in import prices”.2
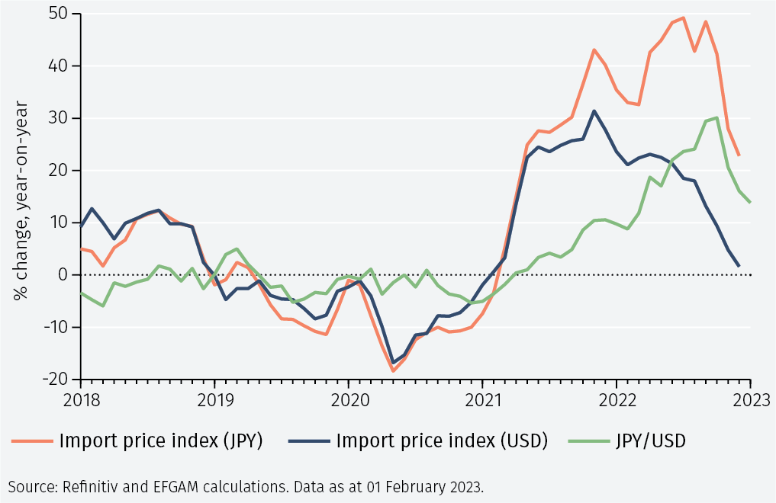
This has been exacerbated by the BoJ maintaining an accommodative monetary policy stance while other central banks have been tightening. The resulting depreciation of the yen has played an important role in pushing up import costs (see Figure 2).
Given the limited direct impact of monetary policy on supply side factors, the BoJ maintaining an accommodative policy stance appears justified. This raises the question as to why BoJ Governor Kuroda made relatively hawkish comments following the BoJ meeting on 18 January. Kuroda noted that the BoJ expects wages to rise at “quite a fast pace”.3 This would be an important development for underlying inflation dynamics, acting as a boost to consumer purchasing power and having the potential to cause demand led inflation. If this is the case, the Bank of Japan could begin increasing interest rates.
Lessons from history
It is interesting to consider economic conditions in Japan in 1989, the last time the BoJ significantly tightened monetary policy. The BoJ Governor Yasushi Miento’s opening speech from the meeting in April 1990 highlights some striking similarities. The BoJ judged that rate increases were necessary due to rising import costs, a depreciation of the yen and wage rises (see Figure 3).4 Notably, this period marks the last time that wage growth maintained a pace above 3%, the level Kuroda has pointed to as the required pace of wage rises to sustain inflation at the BoJ’s 2% target.
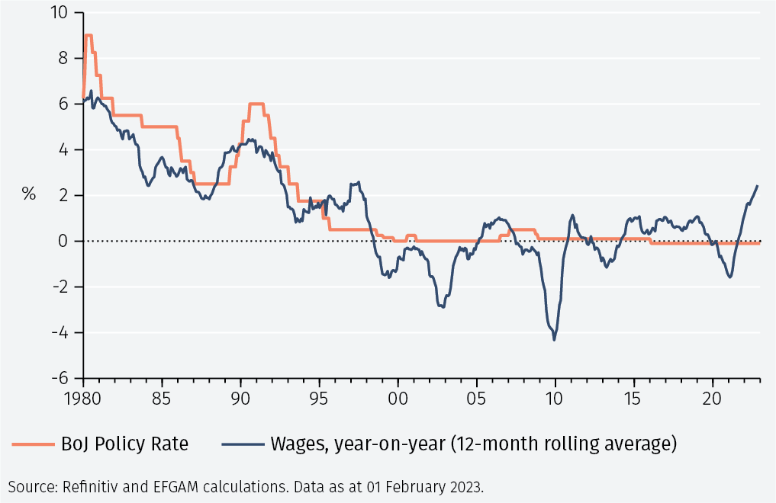
The only factor missing today from those present in 1989 is wage rises. In the latest data, 12-month rolling average wages rose 2.45% YoY. Wage increases are expected to pick up pace around the start of the Japanese fiscal year on 1 April, continuing the momentum seen in 2022 and opening the door for a normalisation of monetary policy.5
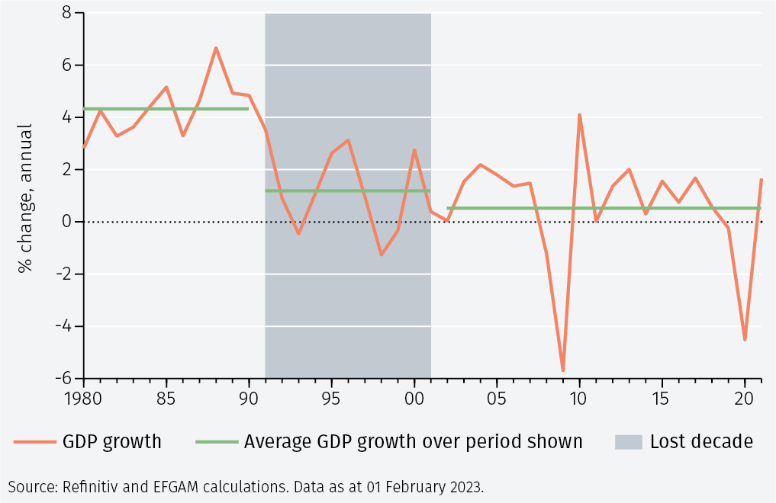
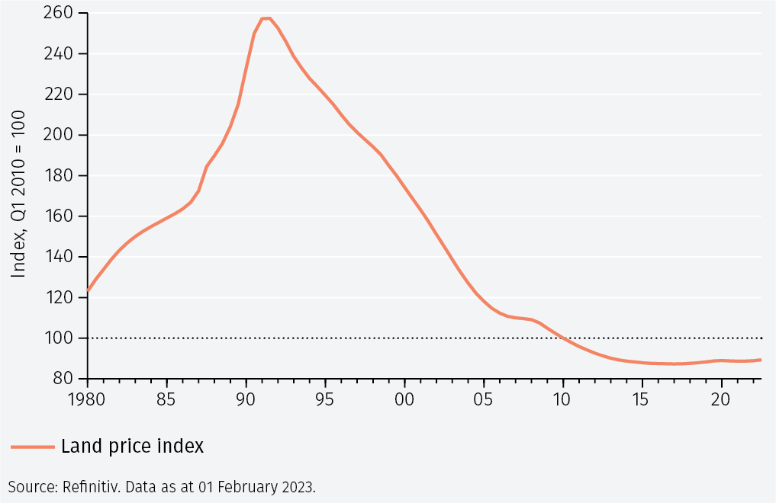
Yet tighter monetary policy is still not a foregone conclusion. When the BoJ began raising rates in 1989, it was stumbling towards a decade-long period of economic stagnation and price deflation which became known as the “Lost Decade” (see Figure 4).6, 7 This is something the BoJ would be keen to avoid.
The IMF points to the “Lost Decade” being a result of a failure to deal proactively with a collapse of asset prices, including for land. It is reassuring that current land prices appear low and stable, suggesting tightening of policy is unlikely to cause another “Lost Decade” (see Figure 5).
Furthermore, the cumulative interest rate increases from May 1989 to August 1990 took the policy rate from 2.5% to 6.0%, putting great stress on economic activity and the Japanese financial system. The policy rate currently stands at -0.1% and is unlikely to reach anywhere near the peak in 1990 if the BoJ does indeed begin to increase rates.
The final piece in the jigsaw puzzle is to look at how the BoJ views the Japanese economy going forward. In its median forecast, the BoJ sees real GDP growth of 1.7% in fiscal year 2023, followed by 1.1% in 2024.8 Core CPI inflation is expected to drop below the BoJ target to 1.6% in fiscal year 2023 before rising closer to the target at 1.8% in 2024.
Given that the BoJ expects growth to be above the average of the past twenty years, while core inflation is also expected to be sustained close to its target level and driven by demand factors, we could see some degree of monetary tightening from the BoJ later this year.
Pinpointing exactly when this will occur is difficult. Matters are complicated by the retirement of BoJ Governor Kuroda, on 8th April. Japanese Prime Minister Kishida is expected to nominate Kuroda’s replacement in February. Therefore, it is unlikely that the BoJ will take any decisive actions in its last meeting under Kuroda in March, with policy changes more likely at the April meeting.
Tighter monetary policy will impact growth and inflation through multiple channels. Exports accounted for 18.8% of GDP in Japan in 2021.9 Any appreciation of the yen resulting from monetary tightening would make Japanese exports less competitive and could negatively impact growth.
Imports would also become cheaper with yen appreciation, meaning imported inflation could decline and overall inflation could become more difficult to sustain at 2% as a result. It would be important that inflation was not a result of higher import prices at the time of monetary tightening.
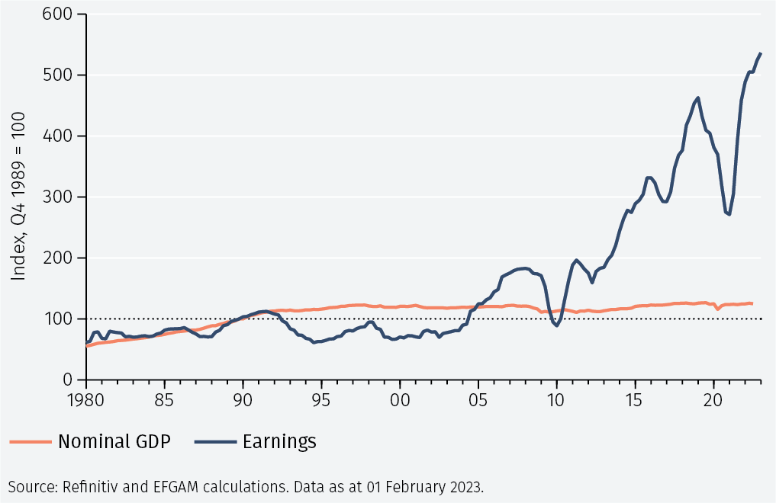
The market impact of these moves should not be overstated. In recent years, corporate earnings in Japan have grown at a faster pace than the overall economy and an increase in interest rates should not have a dramatic impact on this (see Figure 6).10 On top of this, Japanese equity valuations appear cheap relative to history. The Japanese market is trading at a price earnings ratio of 13 compared to its average since 1990 of 27.2.11
Conclusions
To summarise, inflation in Japan is currently being driven by underlying supply factors, meaning the BoJ is unlikely to raise rates in the short run. If wage rises occur as expected, there is potential for inflation to become demand driven and this would increase the likelihood of the BoJ increasing interest rates. The path of rate increases will likely be in small increments and slow. The BoJ is also likely to act cautiously regarding the normalisation of the Yield Curve Control policy, which will be one of the biggest challenges for the arrival of the new Governor in April. Despite the recent underperformance of Japanese equity markets, long term opportunities remain, driven by strong corporate earnings and attractive valuations.12
1 The BoJ introduced a new monetary policy framework in January 2013 in which a 2% YoY CPI inflation target became the price stability mandate.
2 https://www.boj.or.jp/en/mopo/mpmsche_minu/opinion_2023/opi230118.pdf
3 https://www.reuters.com/markets/rates-bonds/boj-bullishness-wages-suggests-days-super-low-rates-are-numbered-2023-01-19/
4 https://www.bis.org/publ/bppdf/bispap31i.pdf
5 https://www.reuters.com/business/retail-consumer/japans-fast-retailing-says-it-will-raise-wages-much-40-2023-01-11/
6 https://www.imf.org/external/pubs/nft/2003/japan/index.htm
7 Average GDP growth in Japan from 1980 to 1990 was 4.4%. From 1991 to 2001 it dropped to 1.2%. From 2002 to 2021 it was 0.5%.
8 The BoJ incorporates market expectations for the path of monetary policy in its forecasts, meaning the forecasts made in December were based on a policy rate which turned positive in April 2023 and peaked at around 0.25% in October 2023.
9 EFGAM calculations using 2021 National Accounts data from Japan’s Cabinet Office.
10 See EFG Outlook 2023: https://www.efginternational.com/insights/2022/2023_outlook.html
11 Based on monthly Japan DataStream market data from Refinitiv
12 The TOPIX Index rose 6.5% (USD) in January compared to a 7.0% increase in the MSCI World Index (USD)
Important Information
The value of investments and the income derived from them can fall as well as rise, and past performance is no indicator of future performance. Investment products may be subject to investment risks involving, but not limited to, possible loss of all or part of the principal invested.
This document does not constitute and shall not be construed as a prospectus, advertisement, public offering or placement of, nor a recommendation to buy, sell, hold or solicit, any investment, security, other financial instrument or other product or service. It is not intended to be a final representation of the terms and conditions of any investment, security, other financial instrument or other product or service. This document is for general information only and is not intended as investment advice or any other specific recommendation as to any particular course of action or inaction. The information in this document does not take into account the specific investment objectives, financial situation or particular needs of the recipient. You should seek your own professional advice suitable to your particular circumstances prior to making any investment or if you are in doubt as to the information in this document.
Although information in this document has been obtained from sources believed to be reliable, no member of the EFG group represents or warrants its accuracy, and such information may be incomplete or condensed. Any opinions in this document are subject to change without notice. This document may contain personal opinions which do not necessarily reflect the position of any member of the EFG group. To the fullest extent permissible by law, no member of the EFG group shall be responsible for the consequences of any errors or omissions herein, or reliance upon any opinion or statement contained herein, and each member of the EFG group expressly disclaims any liability, including (without limitation) liability for incidental or consequential damages, arising from the same or resulting from any action or inaction on the part of the recipient in reliance on this document.
The availability of this document in any jurisdiction or country may be contrary to local law or regulation and persons who come into possession of this document should inform themselves of and observe any restrictions. This document may not be reproduced, disclosed or distributed (in whole or in part) to any other person without prior written permission from an authorised member of the EFG group.
This document has been produced by EFG Asset Management (UK) Limited for use by the EFG group and the worldwide subsidiaries and affiliates within the EFG group. EFG Asset Management (UK) Limited is authorised and regulated by the UK Financial Conduct Authority, registered no. 7389746. Registered address: EFG Asset Management (UK) Limited, Park House, 116 Park Street, London W1K 6AP, United Kingdom, telephone +44 (0)20 7491 9111.