- Date:
Infocus - Bond Market Blues
The recent rapid reversal of government bond yields has caused consternation for some investors, with renewed fears about inflation, funding costs and the potential for tighter financial conditions to dampen an already fragile economic recovery. However, as Daniel Murray argues in this issue of Infocus, those fears seem overplayed.
Introduction
Government bonds rallied hard last year in response to the economic uncertainty associated with the coronavirus pandemic. However, as confidence has built in the economic recovery, yields have backed up. From the low of around 0.5% in August last year to the March high, the ten-year US Treasury yield rose by around 1.2%, although it has declined a little recently. Moreover, because duration is high as a result of the low level of starting yields, capital losses have been relatively large.
Should we be concerned about the potential impact on the economy resulting from higher borrowing costs? What are higher yields telling us about inflation expectations? And will bond yields continue to move higher?
Recent experience in an historical context
Figure 1 shows the ten-year US Treasury yield (T10) over the past 30 years together with CPI inflation. The chart highlights periods during which the T10 yield has risen by at least 100bps within a period of six months or less. It illustrates a number of interesting things.
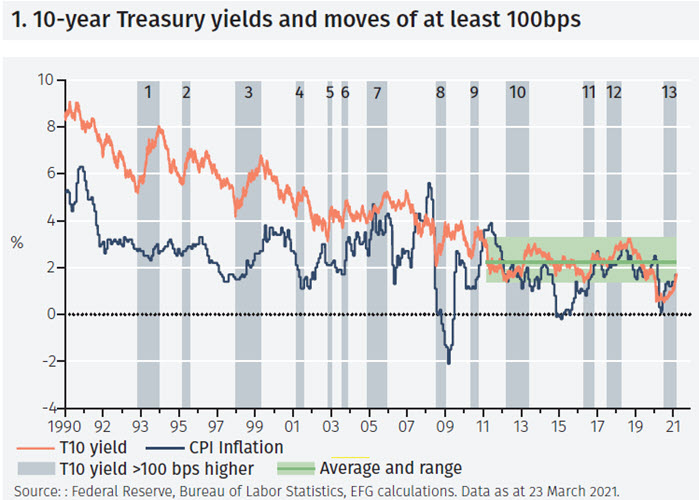
First, focus on the green rectangle on the right of the chart which represent the yield range (shaded) and the average yield (solid line) between the middle of 2011 and the beginning of last year immediately prior to the crisis. The low over this period was 1.36% and the high was 3.24%. The lurch down in yields as the crisis hit is understandable against the huge uncertainty that erupted at that time. However, as the uncertainty has faded the T10 yield has returned to the lower end of its prior range. This seems like a reasonable response as the risks have subsided. If that process were to continue, the yield might well rise further although this would not necessarily signal anything other than continued reversion to the pre-Covid situation.
Secondly note how the recent increase in yields has been accompanied by a similar and coincident increase in CPI inflation. Whilst the relationship between the T10 yield and inflation has varied historically, over the past four years it has been reasonably tight. The recent back up in bond yields may therefore be viewed as a reaction to the rebound in inflation from the very low levels of last year. Yields have risen not in anticipation of higher inflation but in concert with it.
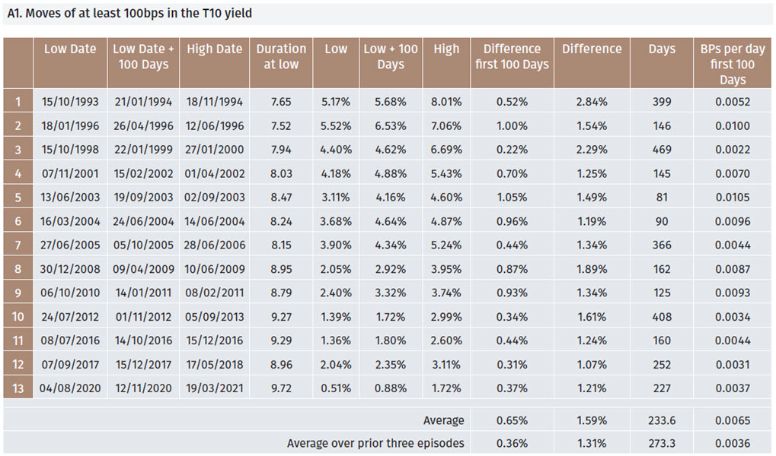
The third point to note relates to the size and speed of the move. The average yield reversal from bottom to top over the previous 12 episodes was 1.59% and took 234 days. It could be argued that we should look only at the previous three episodes given the lower level of yields over that period and the potential impact of quantitative easing: the average yield increase over episodes 10 to 12 was 1.31% and took 273 days. The most recent episode has seen the T10 yield rise by 1.21% over a period of 227 days, which looks unexceptional both in terms of size and time. Table A1 in the Appendix provides more detail.
Potential economic impact
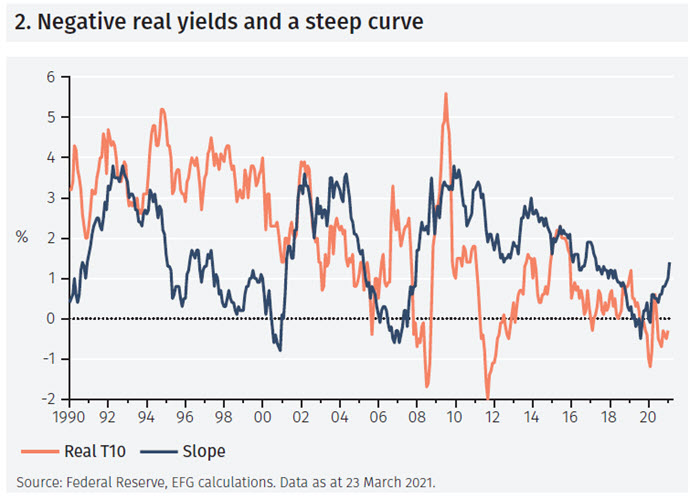
There are two primary factors to consider with regard to the economic impact: (i) real yields (ii) the slope of the curve. Both point to ongoing economic recovery.
As shown in Figure 2, real yields – nominal yields less inflation – remain firmly negative, despite the recent increase in nominal yields. This implies that borrowing remains very cheap, something that is supportive of economic activity. Furthermore, because longer dated bonds have sold off as the short end has remained well anchored, the yield curve has steepened meaningfully since the middle of last year. As has been well established in the economic literature, a steep curve is a positive and reliable signal for growth over the following 12 months.1
Debt service costs
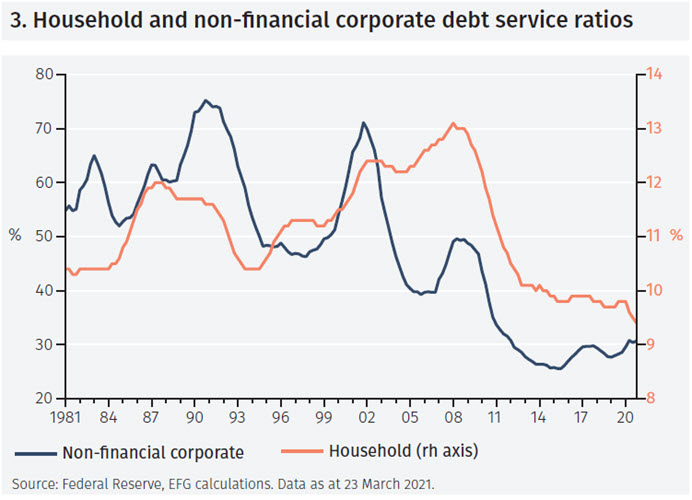
Another fear that investors have is that borrowing costs are going to rise sharply as a result of higher yields and that this will create stress in debt markets. However, as shown in Figure 3, debt servicing costs remain well contained in the US, suggesting the economy can withstand a significant rise without causing stress, despite the large increase in private and public sector debt outstanding. Household debt servicing costs are at an all time low relative to income while the nonfinancial corporate debt service ratio is only marginally higher than its 2015 low point. Similarly, government debt service costs remain low as a result of low bond yields.
Affordability is also reflected in credit markets by virtue of the fact that spreads remain tight, both in investment grade and high yield debt. Whilst some sectors will undoubtedly experience coronavirus related challenges over the next few months, there is no evidence that the problems are economy wide. It is true, at the same time, that the average maturity of debt has increased over the past few years, something that reduces corporate funding pressures. For example, the maturity of the ICE Bank of America US Corporate Index has increased from a little over 10 years in 2018 to a bit under 12 years today.
Term premia
The final section of this report relates to what are known as term premia. To understand this concept, think about an investor who can either buy one 2-year bond or two 1-year bonds a year apart. If the yield-to-maturity (YTM) today on the first 1-year bond is 2% and the expected YTM on a 1-year bond bought in 12 months’ time is 2.5%, the investor would require an annual yield of at least 2.25% to be persuaded to buy the 2-year bond instead of two 1-year bonds. However, there is uncertainty for the investor because they don’t know for sure what will be the YTM on the 1-year bond in 12 months’ time. The term premium is the additional amount investors require to be compensated for that uncertainty.
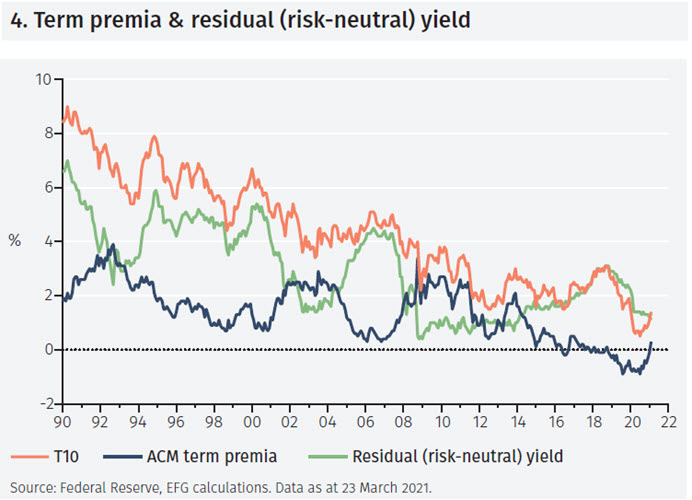
Various methods have evolved for estimating government bond term premia. One that has become popular over recent years was developed at the New York Fed by Adrian, Crump and Moench and is known as the ACM term premium.2 By construction, the difference between government bond yields and term premia provide an estimate of market expectations of short-term interest rates. This is known as the risk neutral yield – it will be identical to the government bond yield if the term premium is 0%.
Figure 4 shows the T10 yield (orange line), the ACM term premia (dark blue line) and the risk-neutral yield (green line). The entirety of the move higher in the T10 yield is due to an increase in the ACM risk premia – the risk neutral yield has declined marginally over the period since the T10 yield has reversed. The implication is that, according to this methodology, market expectations of interest rates have fallen a little, an observation that fits with the dovish messages emanating from the Federal Reserve. For example, the dot-plots from the Fed’s March meeting suggest that a rate hike is several years away. Given that the Fed has indicated it will not start to tighten policy until inflation is threatening to move persistently above its 2% target, a corollary is that market inflation expectations are also benign.
Whilst a full discussion is beyond the scope of this report, the difference between the nominal yield and the yield on inflation protected government bonds (TIPS) is often used as a measure of market inflation expectations. This measure has increased sharply recently – the five-year version is currently at its highest since 2008 – something that has added to market concerns about an increase in inflation. This observation is in apparent contradiction with the term premium model. However, the spread between the nominal yield and the TIPS yield is known as a poor estimate of inflation expectations due to factors such as inflation uncertainty and market liquidity.3
Conclusions
The sharp run up in bond yields since last summer has fuelled concerns about rising inflation and the potential for tighter market financing conditions to dampen the prospects for economic recovery. However, these concerns seem misplaced or a number of reasons:
i. The T10 yield is only now at the bottom of its pre-Covid range;
ii. The yield increase is commensurate with the coincident increase in inflation from the crisis induced lows of last year;
iii. The current episode is similar to previous periods in which yields have increased and looks unexceptional in this context;
iv. Real yields are negative and the yield curve slope is positive, both of which are supportive of economic activity;
v. Credit spreads are tight – there are no signs of stress in the corporate bond market;
vi. Debt service ratios remain low;
vii. The move higher in the T10 yield is accounted for entirely by term premia, suggesting market expectations of rates and inflation are benign.
Footnotes
1 See for example ‘Yield Curve and Predicted GDP Growth’, Federal Reserve Bank of Cleveland. https://www.clevelandfed.org/en/our-research/indicators-and-data/yield-curve-and-gdp-growth/background-and-resources.aspx
2 ‘Pricing the Term Structure with Linear Regressions’ by Tobias Adrian, Richard K Crump and Emanuel Moench, Federal Reserve Staff Report No. 340.
3 ‘The Persistent Compression of the Breakeven Inflation Curve’ by Richard K. Crump, Nikolay Gospodinov and Desi Volker, Liberty Street Economics, Federal Reserve Bank of New York, March 2021.
APPENDIX
Important Information
The value of investments and the income derived from them can fall as well as rise, and past performance is no indicator of future performance. Investment products may be subject to investment risks involving, but not limited to, possible loss of all or part of the principal invested.
This document does not constitute and shall not be construed as a prospectus, advertisement, public offering or placement of, nor a recommendation to buy, sell, hold or solicit, any investment, security, other financial instrument or other product or service. It is not intended to be a final representation of the terms and conditions of any investment, security, other financial instrument or other product or service. This document is for general information only and is not intended as investment advice or any other specific recommendation as to any particular course of action or inaction. The information in this document does not take into account the specific investment objectives, financial situation or particular needs of the recipient. You should seek your own professional advice suitable to your particular circumstances prior to making any investment or if you are in doubt as to the information in this document.
Although information in this document has been obtained from sources believed to be reliable, no member of the EFG group represents or warrants its accuracy, and such information may be incomplete or condensed. Any opinions in this document are subject to change without notice. This document may contain personal opinions which do not necessarily reflect the position of any member of the EFG group. To the fullest extent permissible by law, no member of the EFG group shall be responsible for the consequences of any errors or omissions herein, or reliance upon any opinion or statement contained herein, and each member of the EFG group expressly disclaims any liability, including (without limitation) liability for incidental or consequential damages, arising from the same or resulting from any action or inaction on the part of the recipient in reliance on this document.
The availability of this document in any jurisdiction or country may be contrary to local law or regulation and persons who come into possession of this document should inform themselves of and observe any restrictions. This document may not be reproduced, disclosed or distributed (in whole or in part) to any other person without prior written permission from an authorised member of the EFG group.
This document has been produced by EFG Asset Management (UK) Limited for use by the EFG group and the worldwide subsidiaries and affiliates within the EFG group. EFG Asset Management (UK) Limited is authorised and regulated by the UK Financial Conduct Authority, registered no. 7389746. Registered address: EFG Asset Management (UK) Limited, Leconfield House, Curzon Street, London W1J 5JB, United Kingdom, telephone +44 (0)20 7491 9111.