- Date:
Infocus - With the Federal Reserve facing the difficult issue of deciding when to reduce bond purchases, investors have followed US inflation developments closely in recent months. In this issue of Infocus, EFG chief economist Stefan Gerlach compares the two main measures of US inflation.
With the Federal Reserve facing the difficult issue of deciding when to reduce bond purchases, investors have followed US inflation developments closely in recent months. In this issue of Infocus, EFG chief economist Stefan Gerlach compares the two main measures of US inflation.
With the likelihood and timing of any Fed decision to taper bond purchases depending in part on the outlook for inflation, investors have followed US price developments closely in recent months. The central issue from the Fed’s perspective is whether the recent increase in inflation will require a tightening of monetary policy to return it towards the 2% level or if it will do so on its own. Investors are keenly watching for any evidence that inflation pressures are abating.
The behaviour of CPI and PCE inflation
In doing so they are helped by the fact that the US authorities publish two indices that can be used to measure inflation. The first of these is the Consumer Price Index, CPI, which is published by the Bureau of Labor Statistics.1 The second price index is the deflator for Personal Consumption Expenditures, PCE, which is published by the Bureau of Economic Analysis.2
As Figure 1 shows, inflation computed using these two price indices behaves somewhat differently. While it is sensible for market analysts to look at both measures, it is important to be aware of the differences and why they arise.
1. Annual inflation in the US
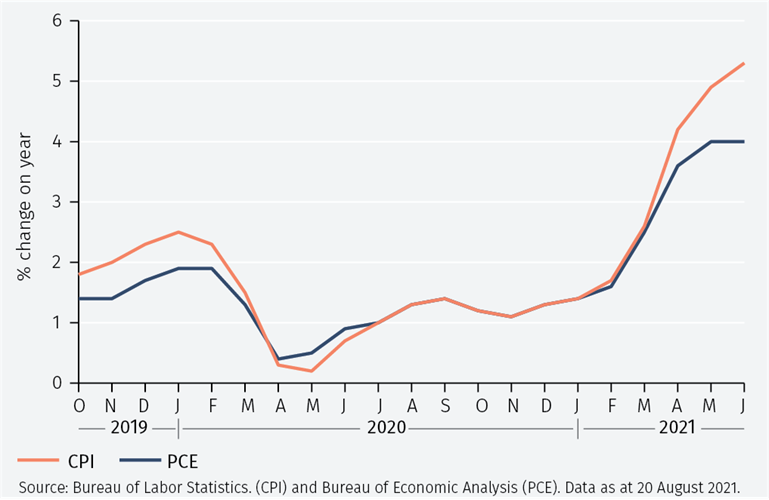
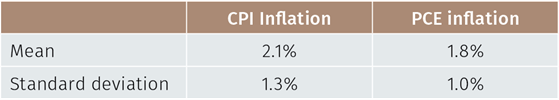
Figure 2, which contains the mean and standard deviation of inflation over 12 months over the period January 2001 – June 2021, shows that CPI inflation has on average been a little higher and more volatile than PCE inflation.
2. Inflation over 12 months, Jan 2001 – June 2021
To get a better sense of these differences, Figure 3 shows a scatter plot of CPI and PCE inflation.
3. Annual CPI and PCE inflation
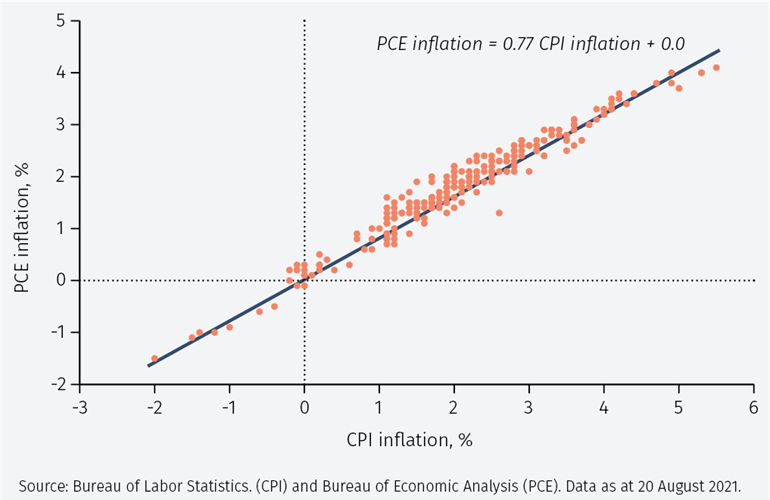
There is an almost perfect relationship between the two variables, as evidenced by a correlation coefficient of 0.98. A fitted line through the data shows that PCE inflation can be thought of as being about 0.8 times CPI inflation. This implies that CPI inflation is above PCE inflation when inflation is positive, but below PCE inflation when inflation is negative. Overall, PCE inflation varies less than CPI inflation.
Which measure is more important?
Whether observers should focus on PCE or CPI inflation depends on the nature of the interest in inflation. If it arises from a concern about the outlook for monetary policy, however, then the answer is clear: PCE inflation is more important than CPI inflation.3
1See https://www.bls.gov/cpi/
2See https://www.bea.gov/data/personal-consumption-expenditures-price-index
3In contrast, the CPI is used to adjust social security payments and is also a reference rate for some financial contracts.
To continue reading, please use the button below to download the full article.
Important Information
The value of investments and the income derived from them can fall as well as rise, and past performance is no indicator of future performance. Investment products may be subject to investment risks involving, but not limited to, possible loss of all or part of the principal invested.
This document does not constitute and shall not be construed as a prospectus, advertisement, public offering or placement of, nor a recommendation to buy, sell, hold or solicit, any investment, security, other financial instrument or other product or service. It is not intended to be a final representation of the terms and conditions of any investment, security, other financial instrument or other product or service. This document is for general information only and is not intended as investment advice or any other specific recommendation as to any particular course of action or inaction. The information in this document does not take into account the specific investment objectives, financial situation or particular needs of the recipient. You should seek your own professional advice suitable to your particular circumstances prior to making any investment or if you are in doubt as to the information in this document.
Although information in this document has been obtained from sources believed to be reliable, no member of the EFG group represents or warrants its accuracy, and such information may be incomplete or condensed. Any opinions in this document are subject to change without notice. This document may contain personal opinions which do not necessarily reflect the position of any member of the EFG group. To the fullest extent permissible by law, no member of the EFG group shall be responsible for the consequences of any errors or omissions herein, or reliance upon any opinion or statement contained herein, and each member of the EFG group expressly disclaims any liability, including (without limitation) liability for incidental or consequential damages, arising from the same or resulting from any action or inaction on the part of the recipient in reliance on this document.
The availability of this document in any jurisdiction or country may be contrary to local law or regulation and persons who come into possession of this document should inform themselves of and observe any restrictions. This document may not be reproduced, disclosed or distributed (in whole or in part) to any other person without prior written permission from an authorised member of the EFG group.
This document has been produced by EFG Asset Management (UK) Limited for use by the EFG group and the worldwide subsidiaries and affiliates within the EFG group. EFG Asset Management (UK) Limited is authorised and regulated by the UK Financial Conduct Authority, registered no. 7389746. Registered address: EFG Asset Management (UK) Limited, Leconfield House, Curzon Street, London W1J 5JB, United Kingdom, telephone +44 (0)20 7491 9111.