- Date:
Oil prices have returned to the levels of a year ago, a surprising development given the incomplete recovery of the global economy from the pandemic. In this edition of Infocus, GianLuigi Mandruzzato looks at the fundamentals of the oil market and concludes that the risks to the oil price are predominantly to the downside.
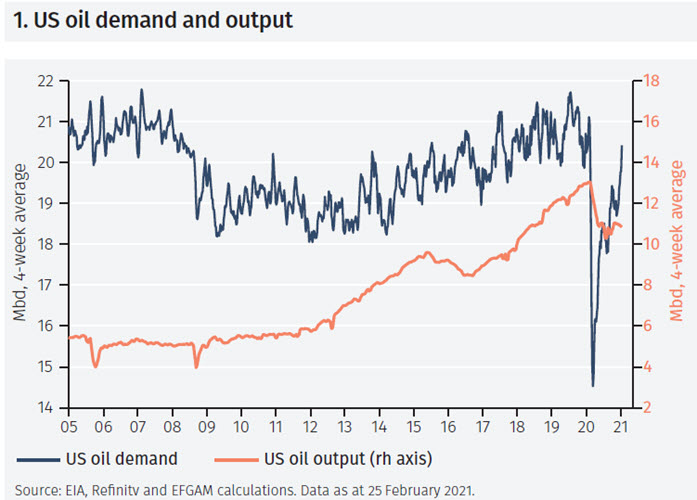
Oil prices have risen by more than 70% since the US presidential election in early November. Many commentators explain the rally by the combination of a slim Democrat majority in the US Senate and confidence about the impact of Covid vaccines, which are expected to boost the chance of further fiscal stimulus and economic recovery. Supporting the rise in oil prices is the fact that US demand for oil products has almost returned to pre-pandemic levels while US oil production has fallen by over 2 million barrels per day (mbd) (see Figure 1). In addition, Saudi Arabia unilaterally reduced production by a further 1mbd for the February-March period. Finally, the freezing weather conditions recently registered in the US, including Texas, have both increased demand for heating oil and temporarily reduced US oil production by an estimated 2 to 4mbd.
The market remains well supplied
This would suggest a tight oil market, with relatively little production to meet demand. Excess demand has been satisfied by drawing on the abundant stocks of oil products that were accumulated during last year’s lockdowns. Despite recent drawdowns, data from the US Energy Information Administration (EIA) show that inventories are still close to alltime highs, both in absolute terms and, more importantly, in relation to demand for oil products (see Figure 2).
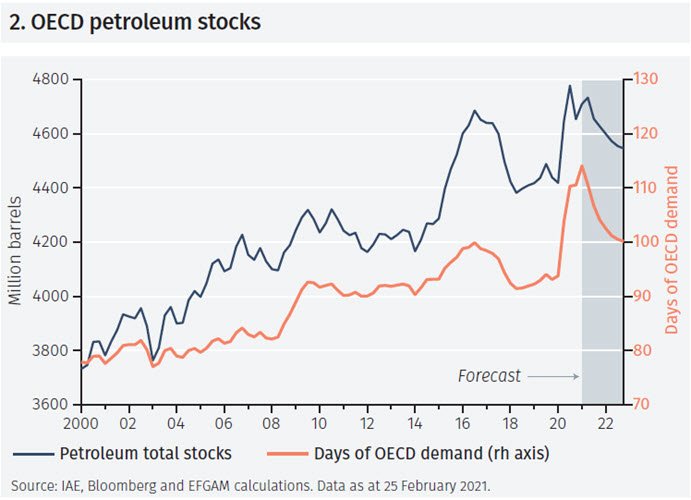
The ratio of stocks to consumption is one of the most informative measures of the availability of petroleum products. Its rapid rise is usually associated with downward pressure on oil prices, as happened after the collapse of Lehman Brothers in 2008-09 and after OPEC’s decision to flood the market in 2015-16, which caused the price of West Texas Intermediate (WTI) oil to fall towards USD 25/bbl. According to our estimates based on International Energy Agency (IEA) projections for oil demand and supply, the stocks-toconsumption ratio will fall in the coming quarters but at the end of 2022 it will still be similar to the previous peak reached in early 2016.
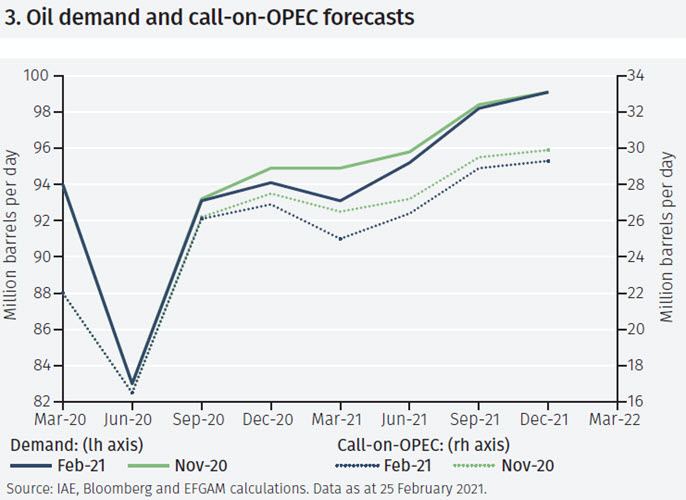
The slow decline in the stocks-to-consumption ratio reflects a deterioration in forecasts of future demand and estimates of OPEC production needed to balance oil demand and supply, a measure known as call-on-OPEC (see Figure 3). In the latest edition of its monthly Oil Market Report, the IEA reduced its estimate of 2021 oil demand by about 0.7 mbd from the level expected in November. The call-on-OPEC estimate fell by 0.9 mbd, the larger reduction reflecting increased expectations for production from non-OPEC countries. Saudi Arabia’s decision to temporarily reduce production can therefore be seen as intended to avoid a new drop in prices rather than a move aimed at raising them.
Is the price right?
It is therefore difficult to explain the recent strong rally in oil prices. In thinking about the degree of market exuberance, it is helpful to estimate a regression model that explains the price of WTI oil as a function of oil supply and demand, the ratio of stocks to consumption and the US dollar effective exchange rate (see Figure 4). The model’s residuals support the hypothesis that the variables are cointegrated and suggests that if the price of WTI oil moves away from the estimated equilibrium values, it subsequently tends to converge back towards them.
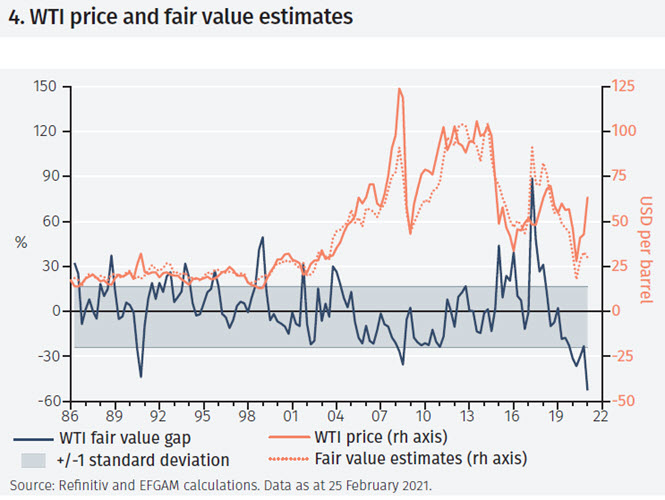
According to the model, the current price, of about USD 63/bbl at the time of writing this note, is more than 50% higher than the equilibrium price, suggesting that risks to future oil prices are predominantly to the downside.
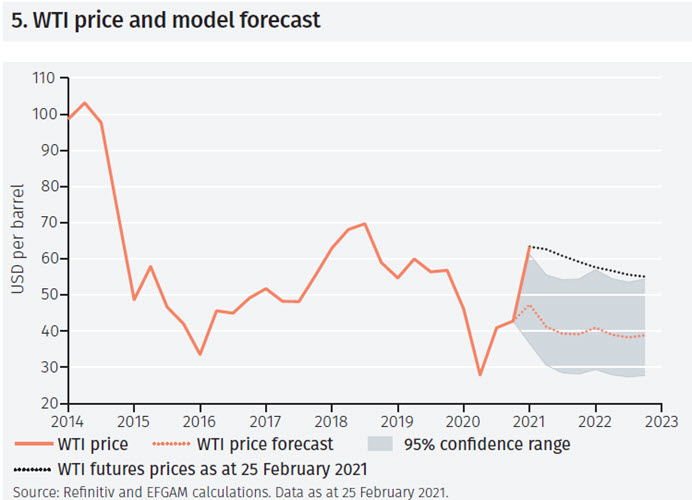
Extending the analysis, it is possible to forecast the future price of WTI oil using a model that expresses the changes in the oil price as a function of changes in the explanatory variables used in the previous model (see Figure 5).2 Based on the IEA’s oil supply and demand projections, the model predicts that the price of crude oil will fall towards USD 40/bbl. It is also interesting to note that, at the time of writing this note, the prices of WTI oil futures contracts lie above the upper end of the 95% confidence range around the model central forecast. This suggests that the market is currently discounting a rather benign scenario where prices are supported by a mix of higher demand, perhaps because of a stronger economic recovery, and lower supply of oil products than projected by the IEA.
The alternatives for OPEC+
This optimistic scenario will be put to the test at the OPEC+ meeting scheduled on 4 March.3 The market seems to be expecting a price-friendly decision, such as a reduction in production or an extended commitment not to increase it.
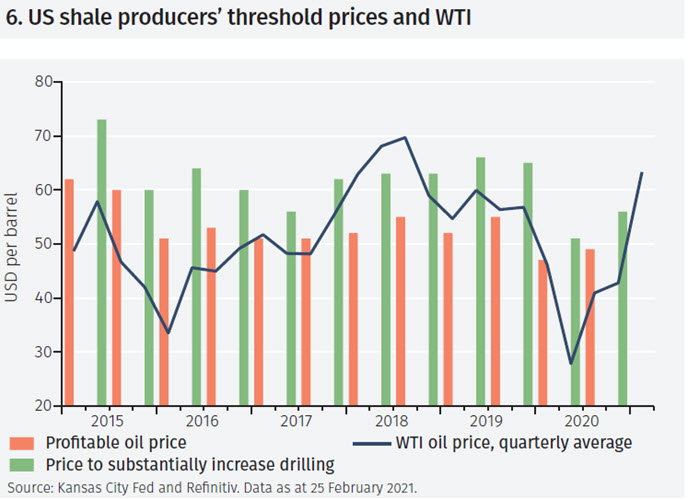
However, this may be insufficient to prevent an increase in oil supply. According to the Kansas City Fed’s quarterly survey, the price of WTI is now higher than US shale oil producers need to be profitable and to encourage a substantial increase in drilling and output (see Figure 6).
The next OPEC+ decision on production levels will be not be easy. Further limiting production would support prices to the benefit of member countries’ public finances, which are heavily dependent on oil-related revenues. However, it would subsidise the profitability of other producers who would also gain market share. This last element might be difficult for OPEC+ to accept: in December 2016, its members controlled 58% of world oil production, but their share has since fallen to less than 50%.
If OPEC+ prioritises market share over price support, the increased oil supply would likely cause prices to fall. Although not ideal, this scenario could still be accepted by Saudi Arabia and Russia, the most influential countries in OPEC+, which together extract 20 mbd and have a combined spare capacity of around 5 mbd. In both countries, the cost of producing a barrel of oil is much lower than prices needed by US shale oil producers to cover their costs. In December 2019, IHS Markit estimated the total cost of producing a barrel of oil was around USD 17/bbl in Saudi Arabia. The estimate for Russia was around USD 43/bbl but, as Russian production costs are predominantly denominated in local currency, the 15% depreciation in the rouble against the US dollar since then will have likely pushed Russia’s oil break-even cost below USD 37/bbl. This leaves ample room for Saudi Arabia and Russia to weather a period of significantly lower prices without suffering significant setbacks.
Conclusions
The sharp rise in oil prices in recent months has surprised many observers and would suggest an excess of demand over supply. However, inventories remain high when compared to current demand while balancing the physical market seems possible with less OPEC supply than expected a few months ago.
The long-term relationship between the oil price, supply and demand and the ratio of stocks to petroleum products consumption suggests that the price of WTI of around USD 63/bbl is too high. Perhaps the market expects OPEC+ members, led by Saudi Arabia and Russia, to extend current price-supporting policies at their meeting in early March. Should they instead prioritise their market shares, the price trend could quickly turn downwards.
Footnotes
1 The model uses the logarithm of the levels of quarterly data for the period from 1986 to the first quarter of 2021
2 The variables in the model are expressed as logarithm changes of quarterly data. The WTI oil price is the dependent variable and the explanatory variables are the same as in the levels cointegrating model. In addition, the 1-quarter lagged residuals from the cointegrating model is added in the dynamic model.
3 OPEC+, formed in December 2016, includes the OPEC countries, Russia, Mexico and some other oil-producing countries, but not the US.
Important Information
The value of investments and the income derived from them can fall as well as rise, and past performance is no indicator of future performance. Investment products may be subject to investment risks involving, but not limited to, possible loss of all or part of the principal invested.
This document does not constitute and shall not be construed as a prospectus, advertisement, public offering or placement of, nor a recommendation to buy, sell, hold or solicit, any investment, security, other financial instrument or other product or service. It is not intended to be a final representation of the terms and conditions of any investment, security, other financial instrument or other product or service. This document is for general information only and is not intended as investment advice or any other specific recommendation as to any particular course of action or inaction. The information in this document does not take into account the specific investment objectives, financial situation or particular needs of the recipient. You should seek your own professional advice suitable to your particular circumstances prior to making any investment or if you are in doubt as to the information in this document.
Although information in this document has been obtained from sources believed to be reliable, no member of the EFG group represents or warrants its accuracy, and such information may be incomplete or condensed. Any opinions in this document are subject to change without notice. This document may contain personal opinions which do not necessarily reflect the position of any member of the EFG group. To the fullest extent permissible by law, no member of the EFG group shall be responsible for the consequences of any errors or omissions herein, or reliance upon any opinion or statement contained herein, and each member of the EFG group expressly disclaims any liability, including (without limitation) liability for incidental or consequential damages, arising from the same or resulting from any action or inaction on the part of the recipient in reliance on this document.
The availability of this document in any jurisdiction or country may be contrary to local law or regulation and persons who come into possession of this document should inform themselves of and observe any restrictions. This document may not be reproduced, disclosed or distributed (in whole or in part) to any other person without prior written permission from an authorised member of the EFG group.
This document has been produced by EFG Asset Management (UK) Limited for use by the EFG group and the worldwide subsidiaries and affiliates within the EFG group. EFG Asset Management (UK) Limited is authorised and regulated by the UK Financial Conduct Authority, registered no. 7389746. Registered address: EFG Asset Management (UK) Limited, Leconfield House, Curzon Street, London W1J 5JB, United Kingdom, telephone +44 (0)20 7491 9111.