- Date:
Insight Q2 2021
OVERVIEW
After a hesitant first quarter, the world economic recovery looks set to be back on track in most parts of the world. Expectations for the US recovery are markedly more optimistic. However, supply chain bottlenecks and rising inflation are global concerns.
‘China-like’ growth in the US
The combination of substantial fiscal expansion, easy monetary policy and a rapid roll out of the Covid vaccination programme have propelled expectations for the US economy in 2021 much higher. The Fed, for example, now sees 6.5% GDP growth in 2021 and some private sector forecasts are even higher. It is likely that in the second quarter of the year, US GDP will exceed its pre-crisis level and the recovery in China has been even more rapid (see Figure 1). Japan, the UK and the eurozone are broadly expected to be back at their pre-crisis output levels by late 2021.
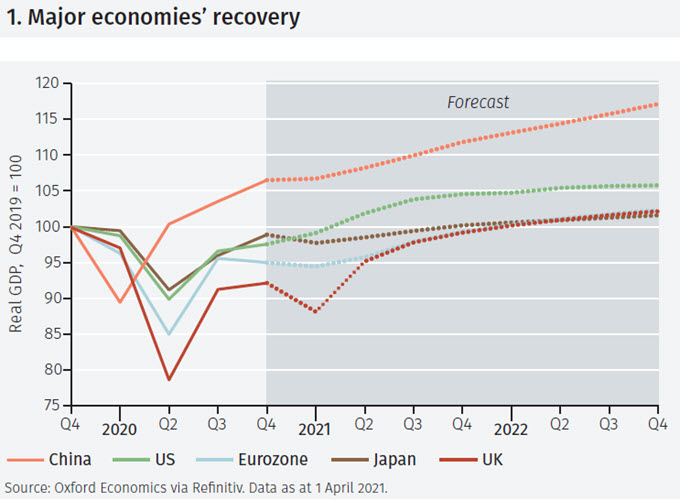
Some do not see that achievement as particularly celebratory. They argue that a good deal more expansion is needed before the ‘output gap’ (the gap between actual output and where it would be if it had continued to grow at its ‘potential’ rate) is fully closed. Indeed, that point has been used to support the latest US fiscal package and provide the basis for another (focused on infrastructure spending): it is best to ‘go big’ to ensure a full recovery, it is argued.
Inflation and the vigilantes
One concern in financial markets is that ‘going big’ will be a mistake: that the stimulus exceeds what is needed to fill the output gap and may lead to inflation. This view has, notably, been put forward by Larry Summers, formerly an advocate of ‘secular stagnation’ (the argument that that there is insufficient demand in the US, leading to a deflationary bias). In that context, his concern about inflation carries weight.
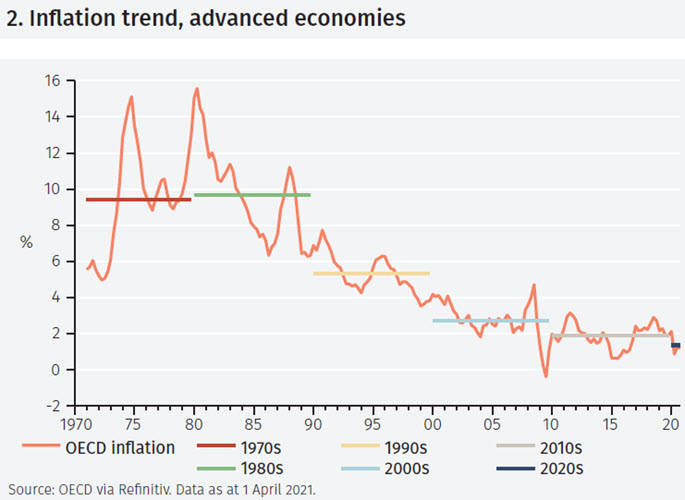
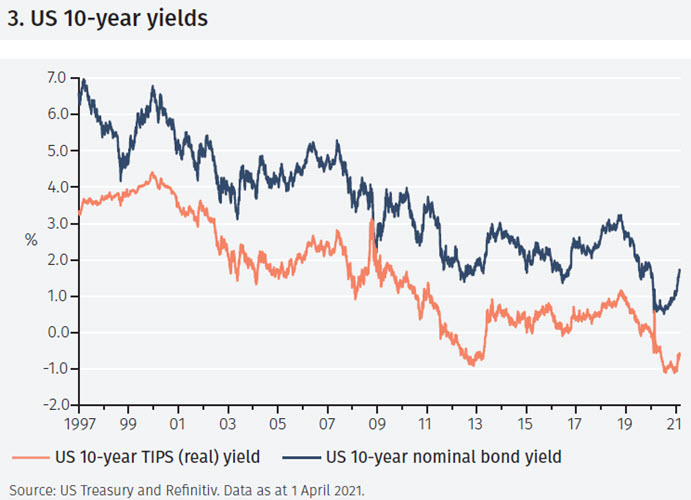
Across the developed economies there has been a gradual ratcheting down of inflation over several decades (see Figure 2): might this trend now be about to go into reverse? Some see this concern, as reflected in the back-up in the US 10-year government bond yield (see Figure 3), as a sign that the ‘bond market vigilantes’ are back in action: they are firing warning OVERVIEWshots to the Treasury and the Fed about the consequences of their lax behaviour. This might lead not just to higher inflation but also other adverse side effects: in particular, a crowding out of private sector investment as funds are directed to finance excessive government deficits.
Others have been caught in the crossfire: the rise in eurozone bond yields, in particular, is unwelcome to policy makers there. Additionally, some argue that fiscal support in Europe has been inadequate: much smaller relative to the shortfall in output than in the US. The eurozone risks, in this analysis, a repeat of the post-global financial crisis response – too little, too late.
How valid are these various concerns? The rise in the US 10-year bond yield from its Covid-crisis low point takes it back to a level that is more consistent with the Fed’s 2% long-term inflation goal. Real yields (on inflation-protected securities) remain negative, suggesting that far from a dearth of available capital and attendant risks of crowding out, there are plenty of funds available for investment.Indeed, the concept of a global savings glut – savings in excess of desired investment – which was first put forward by then Federal Reserve Chair Ben Bernanke in 2005 now has a new manifestation.
Saving to excess
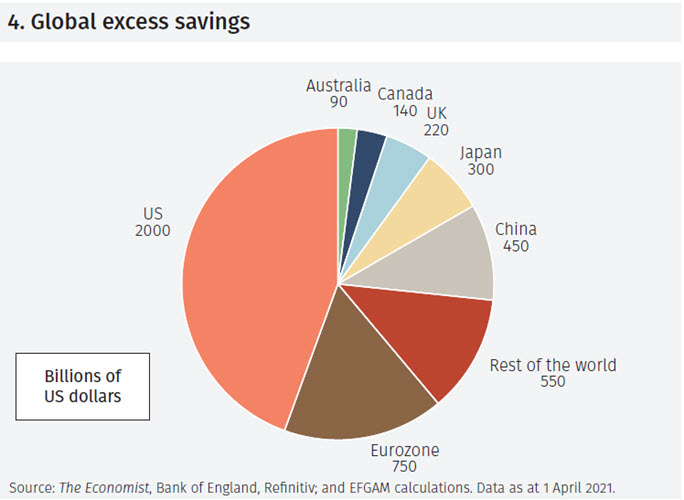
Global excess savings (predominantly by households but also some companies) are estimated at over US$4 trillion, half of it in the US (see Figure 4). For those who have remained in work but whose spending, notably on travel, leisure and entertainment has been constrained, savings have risen sharply. Many others who have lost work have been compensated by various income support and furlough schemes. But clearly some have suffered from job and income losses. That is why the recovery is sometimes described as K-shaped.
This is now more widely recognised by policy makers, not least the Fed, which has emphasised the importance of strengthening the labour market to improve job prospects for more disadvantaged sectors of society.
Money and inflation
The savings which have been accumulated have been, to a large extent, held in bank deposits. In turn, this is the main reason behind the surge in broad money growth that has been seen around the world (see Figure 5). Importantly, this means current developments are different to those after the global financial crisis. At that time, the monetary base increased but it was not reflected in broad money growth. Now, both have increased strongly.
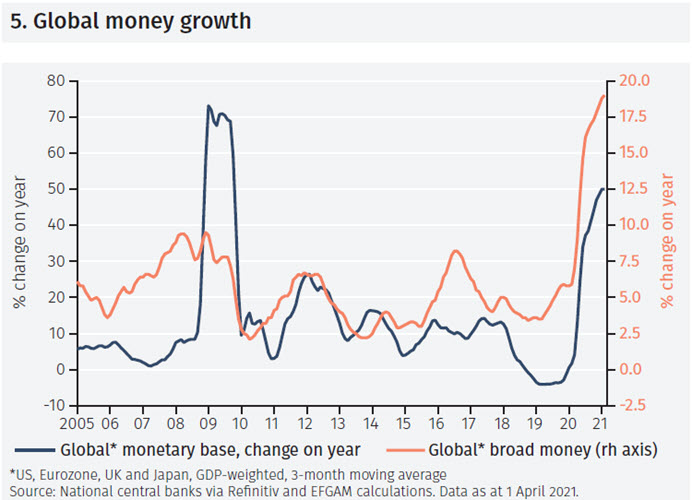
Although the textbook monetarist relationship between faster money growth and future inflation has, for a long time, been insufficiently reliable for its use in policy, there is clearly a concern. In the US, broad money growth is at its fastest since 1943. Milton Friedman himself referred to money as a temporary abode of purchasing power. That puts the focus on what might happen if that purchasing power is turned into actual spending.
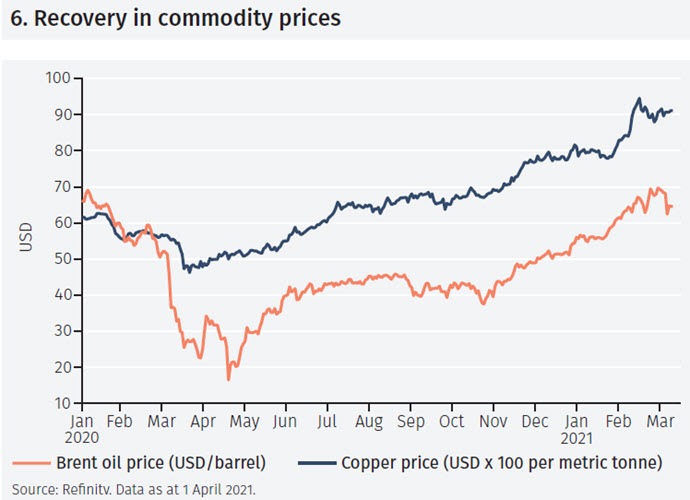
Certainly, the current concerns about higher inflation resonate with those of the 1970s – the last time faster money growth was associated with higher inflation. Oil and commodity prices have moved sharply higher (see Figure 6); demands for higher wages are seen, and are justified, in many industries; bottlenecks in supply have replaced the smooth functioning of ‘just in time’ inventory management; and ‘base effects’ – the comparison of prices this year with depressed prices in early 2020 – will mechanically lead to higher inflation readings in the summer.
However, we doubt that there will be any sustained rise in inflation after the almost inevitable short-term rise. When Covid-19 is contained to the extent that ‘normal’ activity can resume, there may well be some consumer exuberance. But capacity utilisation is low across much of the world economy, unemployment rates remain elevated and a high degree of uncertainty is likely to persist, impeding the recovery in sectors such as travel and entertainment.
Furthermore, in some emerging and developing economies - in Latin America, in particular - Covid is not yet contained and the resilience of the rebound clearly remains in question.
ASSET MARKET PERFORMANCE
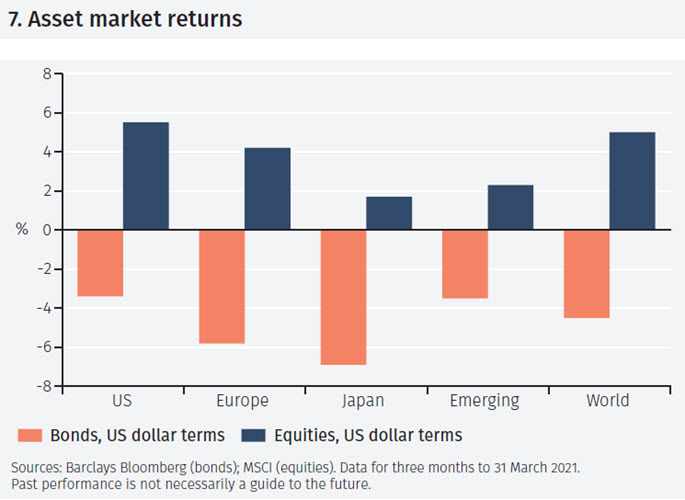
The first quarter of 2021 saw divergent performance of global bonds and equities. The broad decline in bond prices was mirrored by a broad rise in equity markets. The US dollar strengthened against most currencies.
World equity markets saw gains of 5.0% in the first quarter of 2021 (see Figure 7) on the basis of the MSCI World Index in US dollar terms. Global bond market returns, in contrast, were negative, at -4.5% on the basis of the Bloomberg Barclays Global Aggregate Index.1 In almost all markets (the UK and Canada being the notable exceptions) local currency returns were undermined, in US dollar terms, by currency depreciation.
Bond markets
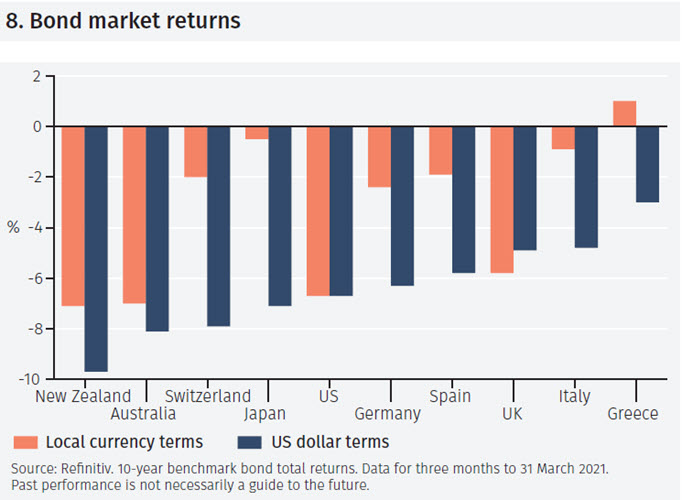
In bond markets, the main trend was a rise in longer-dated bond yields and a steepening of yield curves (that is, long-dated yields rose relative to short-dated yields).
This meant that returns were generally lower for longer maturity bonds. So, in the US market, for example, the total return from 10-year government bonds (shown in Figure 8) was -6.7%. In Australia and New Zealand, local currency returns were weaker than in the US. In both of those economies, rising bond yields reflected growing confidence in economic recovery but despite this both currencies weakened modestly against the US dollar.
In the eurozone, Greek 10-year bonds recorded modest positive returns: yields were stable at around 1% and the high coupon rate on Greek bonds added to returns. However, across all eurozone bond markets and, indeed, Switzerland, returns in US dollar terms were undermined by local currency weakness.
In the UK, 10-year gilt yields rose modestly, resulting in capital losses and negative local currency returns, but sterling was one of the few currencies to gain against the US dollar during the first quarter. In contrast, the yen was the weakest major currency against the US dollar in the period.
Equity markets
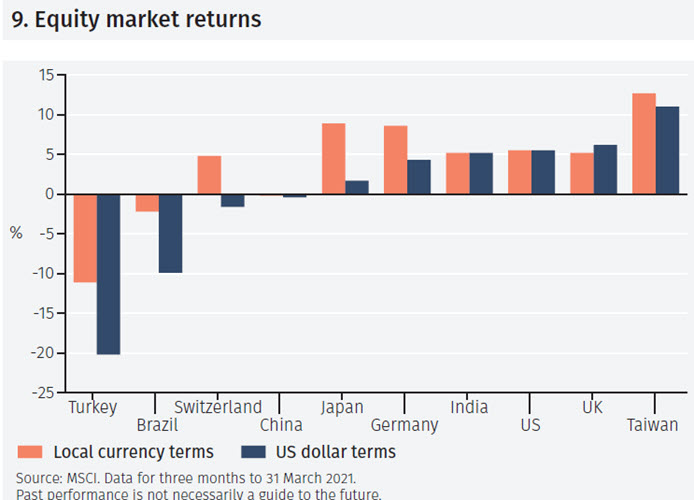
The UK equity market produced positive local currency returns in the first quarter. The explanation is that more cyclical areas of the global equity markets – oil, energy and financials – have a high weight in the UK equity market and they did well in the period.
In Taiwan, strong demand for its technology companies made it one of the best performing equity markets in the first quarter. Concerns about management of the economy in Brazil and Turkey meant those two markets performed poorly in the period.
UNITED STATES
The latest fiscal support measures, a quick rollout of Covid vaccinations and the excess savings built up by consumers provide the ingredients for a rapid rebound of the US economy.
Fiscal largesse and a GDP rebound...
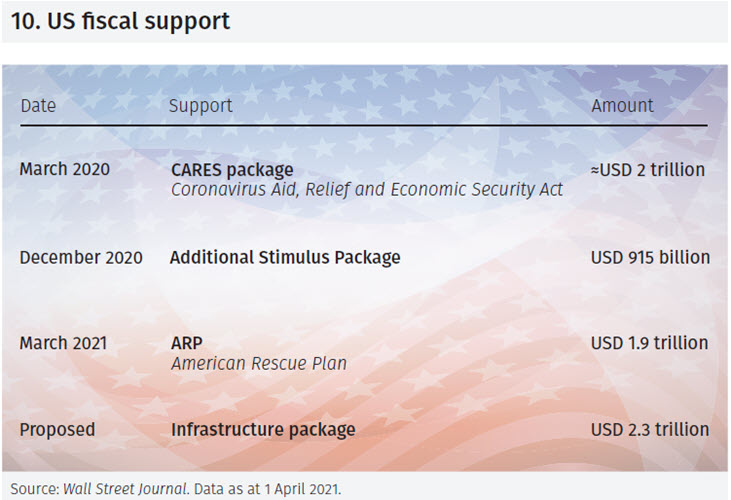
Senator Dirksen, commenting in the 1960s on US government spending said: “a billion here, a billion there and pretty soon you’re talking real money”. Changing billion to trillion, his comments would be apposite now. President Biden’s USD 1.9 trillion fiscal support package follows the March 2020 USD 2 trillion and December 2020 USD 0.9 trillion packages (see Figure 10).
The clearest real-world manifestation of the latest package is the mailing of USD 1,400 checks to individuals, starting in March 2021. But support for schools, families, state and local government and healthcare are also included. What is not included is any infrastructure spending. That is now on the agenda with a USD 2.3 trillion infrastructure bill that includes measures on transport, green investment and reinvigorating some of the more deprived parts of the US economy.
That will, of course, not have an immediate effect on economic growth – large infrastructure projects are notoriously slow and over budget – but arguably will be more important for longer-term US growth prospects. It can be expected to boost the supply potential of the economy. And, importantly, create jobs.
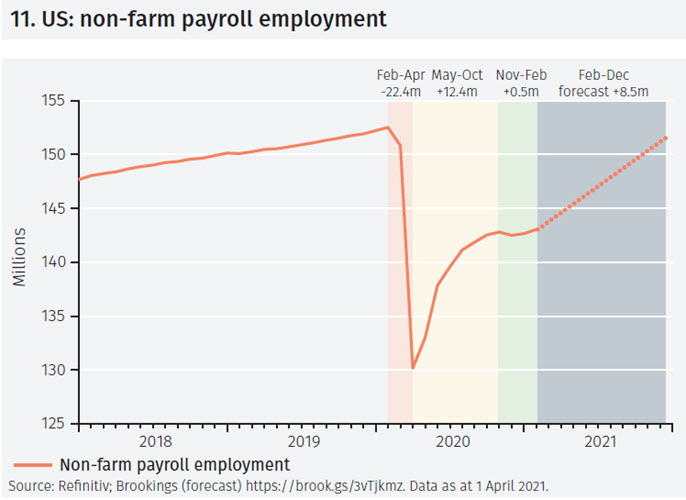
…but a question over employment gains.
The task of job creation is, however, also an immediate one. 22 million jobs were lost in the very early stage of the pandemic. 12 million jobs were created in the next six months, but employment gains then slowed. How many might be created in the remainder of the year? Okun’s Law links GDP growth to employment gains: estimates are that 1% GDP growth increases employment by around 0.5%. With 6.5% GDP growth expect in 2021, that suggests a gain of 460,000 jobs per month.2 However, many of the jobs lost in the pandemic were in ‘in person’ services which are probably not fully reflected in that rule. The projections in Figure 11 are based on a higher number of job gains, averaging 850,000 a month. That would take employment levels back up to almost the pre-pandemic peak.
Government debt servicing
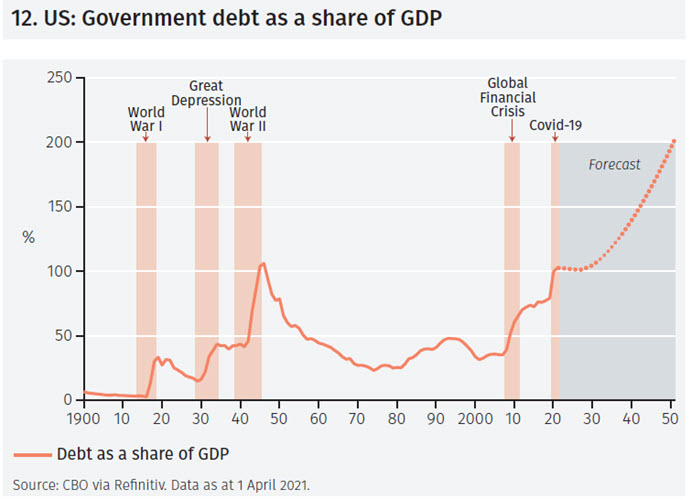
With regard to fiscal policy, there is understandable concern about the rise in government debt levels in the future. CBO projections out to 2050 show it reaching 200% of GDP. That level would be truly astonishing if it had not already been exceeded, with seemingly few adverse consequences, by Japan. The bigger question is whether it is affordable. Bringing the forecast horizon in a little, to 2030, the CBO projects interest payments on government debt will, by then, absorb 12.5% of government revenue. In 1995, when debt levels were much lower but interest rates much higher, interest payments absorbed one quarter of government revenue. So, if (and it is a big if) inflation and interest rates remain contained, it is hard to see a problem.
UNITED KINGDOM
A fast vaccine rollout, high levels of accumulated savings and the spillovers from US expansionary policies are reasons for short-term optimism about the UK economy. But post-Brexit structural issues are a concern.
Short-term boost
The UK’s fast vaccine rollout and the progressive easing of lockdown restrictions provide a solid base for a recovery in the rest of 2021. By 21 June, it is intended that all remaining restrictions on in-contact meeting will be removed, large social events can take place, offices will be able to reopen and remote working will not be required. Although restrictions will be lifted, the bigger issue is whether there will be an appetite to take advantage of this easing. Foreign travel is likely, still, to be restricted until at least later in the year. And, of course, such easing plans have been derailed in the past (most clearly when the planned freedom of movement around Christmas 2020 was curtailed at the last minute).
Certainly, many consumers have the ability to spend more in previously-closed areas such as travel and entertainment. In aggregate, excess household savings (those above what would be expected without lockdown restrictions) amount to £150bn, much of it held in bank deposits. UK consumers may be a ‘coiled spring’ ready to go on a spending binge when restrictions are removed. Or, maybe not. The Bank of England’s own forecast shows just 5% of these excess savings being spent over the next three years. So, a gradual, slow-burn boost to spending and growth rather than a sudden burst may be more likely.
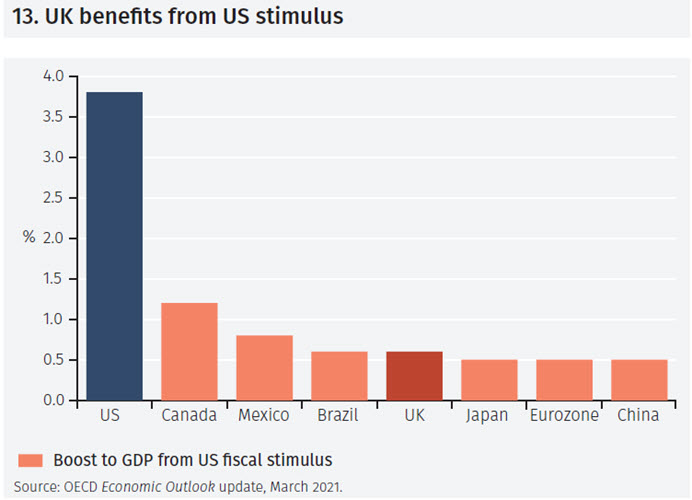
The same can be said of the boost expected from America’s fiscal expansion: the UK is one of the leading beneficiaries, but the impact may be spread over a year or so (see Figure 13).
Long-term uncertainties
Over a longer time horizon – several years – we see three main factors constraining the UK economy. First, the new trading arrangements with the EU are likely to mean the economy is less responsive to changes in demand. For example, workers 2026Forecastfrom central and eastern Europe, so important in many industries from seasonal agriculture to healthcare, will find access to the UK more difficult. Second, more generally, the influence of global forces on UK inflation may be reduced, given increased barriers to trade. Currently, UK 10-year government bonds have a lower yield than US bonds (see Figure 14).
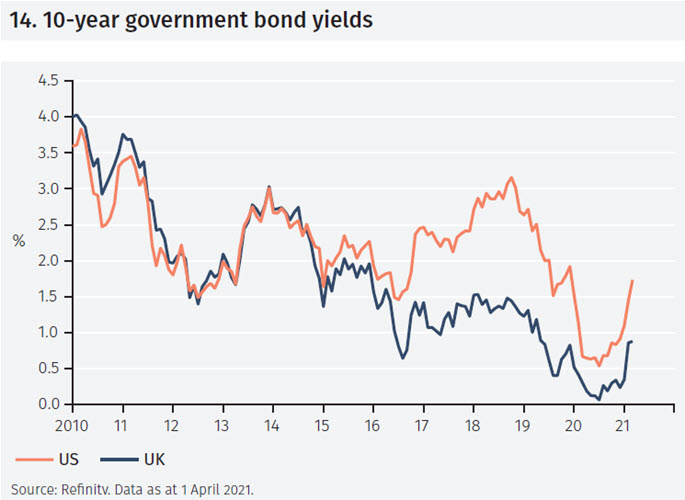
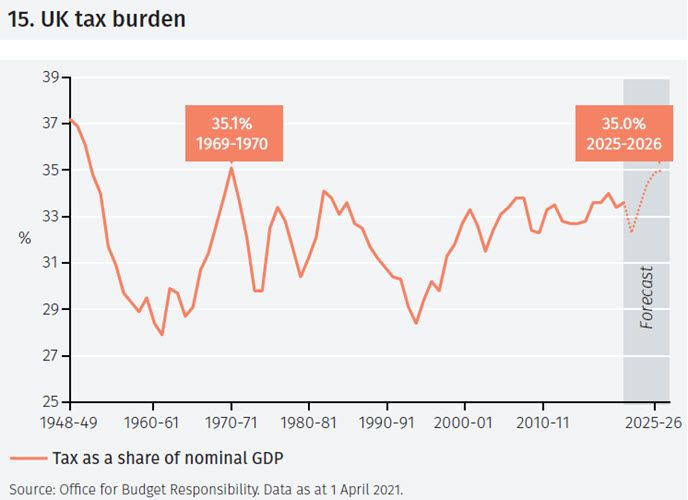
This appears anomalous if the UK becomes a more inflation-prone economy with a reduced ‘safe haven’ status. Third, with tax increases (see Figure 15), especially corporate tax increases, on the horizon, the UK may find it hard to retain and develop its status as an attractive low-tax base for international businesses.
The UK intends to pivot trade towards the Indo-Pacific region, one with which the UK has strong historic and cultural ties.3 The strategy makes sense in that the region is set to be one of the fastest-growing in the world, but it is far from certain it can quickly substitute for any lost trade with the UK’s European neighbours.
EUROZONE
The eurozone is gripped by another wave of Covid, particularly affecting France. The monetary policy response has been scaled up, but there has been little additional fiscal stimulus.
Fourth wave
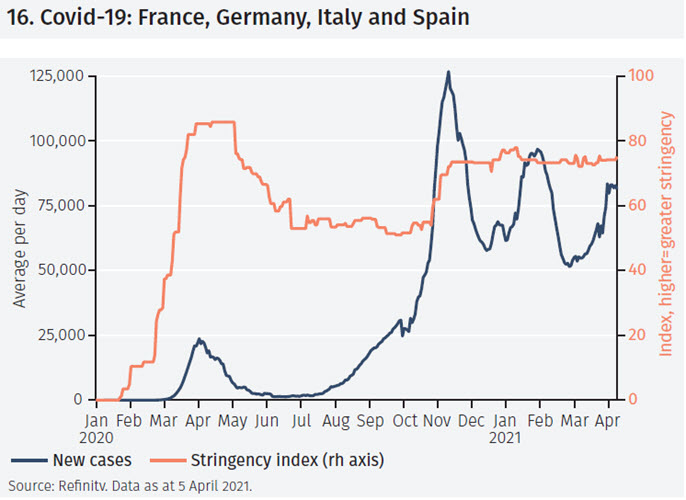
A fourth wave of Covid has spread across the eurozone (see Figure 16). Much of the explanation lies in the slow and hesitant roll out of the vaccination programme. Lockdown measures, which were tightened from October 2020 onwards, have not been eased. Indeed, a third national lockdown in France started on 3 April.
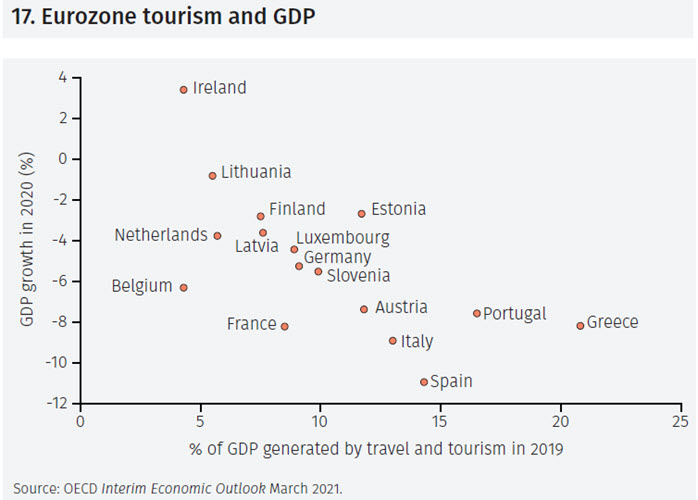
Hopes of opening up southern European economies in time for the summer holiday season have been dented. This will inevitably hit Spain, Portugal, Greece and Italy, economies for which travel and tourism account for a large share of the economy (see Figure 17).
Nevertheless, many businesses have grown more optimistic about a recovery. In Germany, the Ifo business sentiment index in March was at its highest level since June 2019. Manufacturing sector optimism has reached levels last seen in November 2010.
Slow response but no crisis
The response of eurozone fiscal policy to the crisis can be criticised for being too small and too slow. But during 2020, total fiscal support measures across the eurozone were actually larger than in the US, relative to GDP; since then while the US has provided substantial additional support, there have been limited new measures in the eurozone.4 Moreover, some of the measures announced last year have been implemented slowly. In particular, distribution of the €750bn Recovery Fund has not yet started. Italy, which is set to receive €200bn from that fund, is still planning how to use the money. This is far away from the US approach of mailing large checks to individuals. Nevertheless, it is clear that the actions taken by the ECB, notably their recently scaled-up bond-buying programme, have been effective in averting a crisis.
Yield spreads between the former eurozone crisis economies and Germany have reached levels not seen since the late 2000s. Furthermore, the risk of a repeat of the early 2010s ‘doom loop’ – whereby concerns about government solvency spread to the banks and then back to governments – seems low.
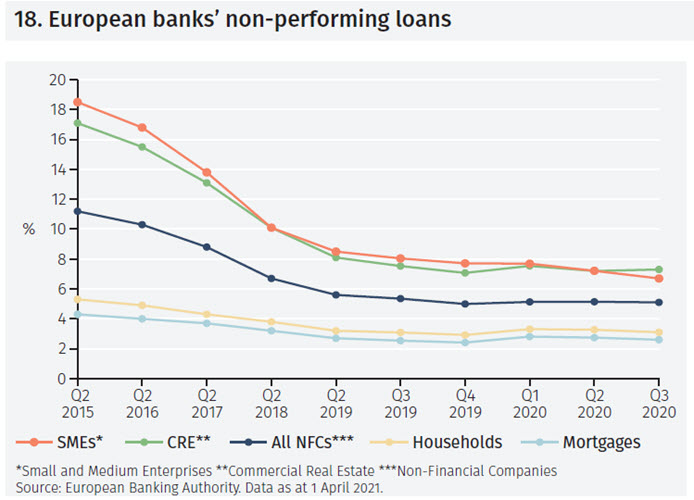
Banks are in a stronger position than they were at that time: the capital and liquidity ratios of all major eurozone banks were above their required levels in the third quarter of 2020; and banks have reduced their non-performing loans (see Figure 18). Solutions such as Greece’s Hercules scheme have been particularly effective. However, some temporary measures to improve NPLs (notably moratoria and guarantees for small business loans) will eventually unwind.
A crisis has been averted but longer-term structural impediments to growth – particularly demographics – remain.
SWITZERLAND
The Swiss economy has held up well in the face of the Covid pandemic. This has been without very large fiscal support. But with inflation still low, should the ‘debt brake’ be reconsidered?
Switzerland and Covid-19
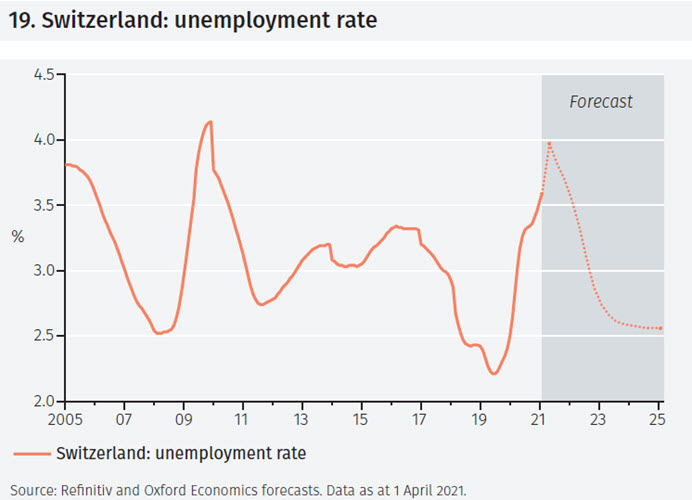
Swiss GDP fell by 3% in 2020. Although sharp, the contraction was less severe than initially feared. Furthermore, GDP is expected to rebound by about 3% in 2021 (taking it back to its pre-pandemic level) and also grow strongly in 2022. However, in common with many other economies, the unemployment rate (which rose to 3.6% in February, the highest since 2010, see Figure 19) is expected to fall only slowly as the economy reopens.
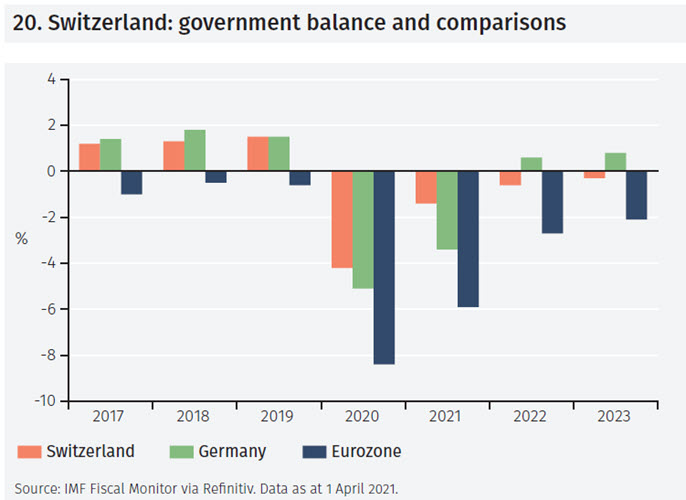
In 2020, CHF16.9 bn, or 2.4% of GDP, was spent to fight the pandemic. For 2021, a further 3.1% of GDP, has so far been budgeted. These extraordinary expenditures are the main reason for the historically large deficit recorded in 2020 and expected in 2021. However, Swiss budget shortfalls look small in comparison to those in Germany and the eurozone (see Figure 20).
Inflation trends
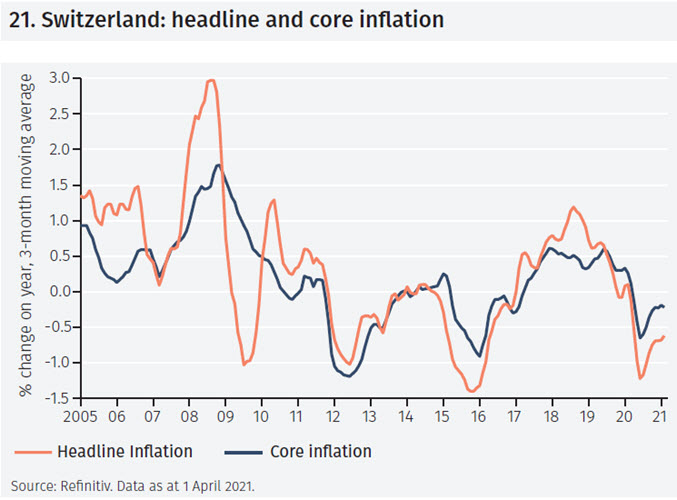
Consumer price inflation has been negative since late 2019 and was -0.5% year-on-year in February. This reflects both a slump in core inflation and in the prices of volatile components like food and energy (see Figure 21). In common with other economies, these inflation measures are set to rise in mid-2021. However, households’ inflation expectations seem to have stabilised at a level consistent with inflation hovering at the low end of the 0-2% range the Swiss National Bank uses to define price stability.
Debt brake
This brings into question the Swiss authorities’ apparent determination to return quickly to fiscal rectitude. The 2022-24 financial plan of the Federal Council envisages a balanced budget in 2022 and a small surplus in the following two years. This plan complies with the so-called debt brake in place since 2003. This rule, which aims at stabilising the debt by means of a balanced structural budget across the cycle, was key to reducing the debt-to-GDP ratio to 40% in 2019 from 58% in 2002.
The rule gives the Federal Council six years to offset any excessive budget shortfall. It would seem appropriate to use that flexibility. A premature fiscal tightening could risk dampening the recovery. And too tight a fiscal policy would leave the burden of supporting the economy on monetary policy, complicating the SNB’s exit from negative interest rates and foreign exchange interventions that attract so many criticisms.
ASIA
Although China is noted for its swift recovery, India is not so far behind. India’s long-standing vulnerabilities – high inflation, a current account deficit and a weak currency – may now be less of a concern for international investors.
Chasing China
The sharp recovery in China’s economy is, in a sense, the envy of the world. The drop in GDP in the first quarter of 2020 was fully recovered by the second quarter and by the end of 2020 GDP was 7% above its pre-pandemic level (see Figure 22).
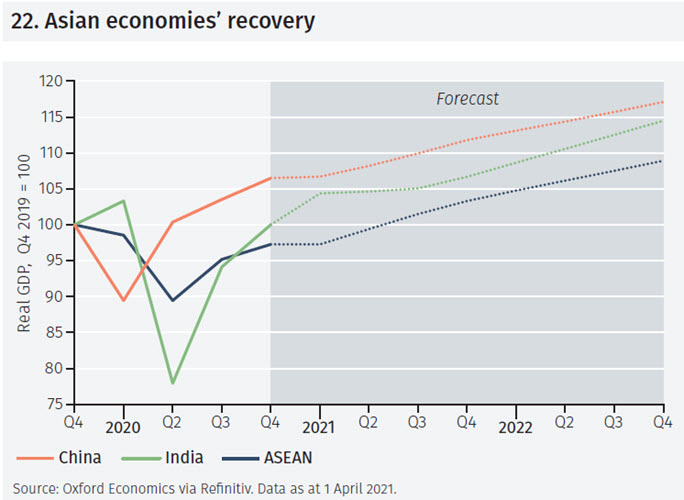
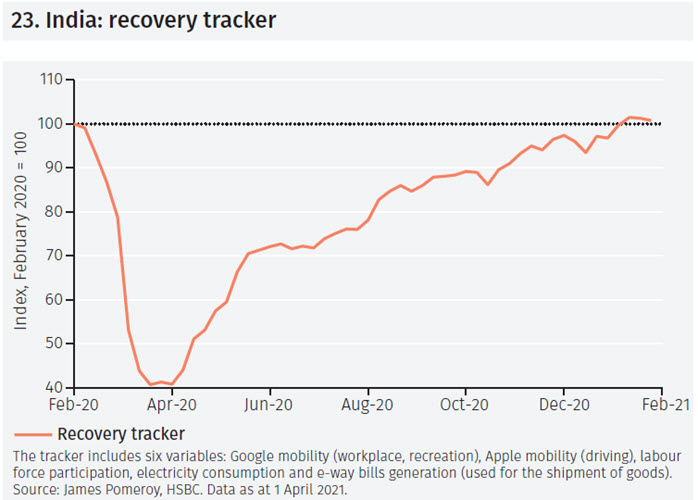
What will surprise many is that India has also regained its pre-pandemic GDP level, according to official data. The quality of such statistics in many Asian economies is often questioned; and Indian GDP data, in particular, have come in for widespread criticism.5 But alternative data sources, on mobility, labour force participation, electricity usage and goods shipments, which are arguably more reflective of the post-pandemic recovery, show the same trend (See Figure 23).
Currency concerns
One common concern expressed by actual and potential investors in India is the Indian rupee’s weakness (see Figure 24).
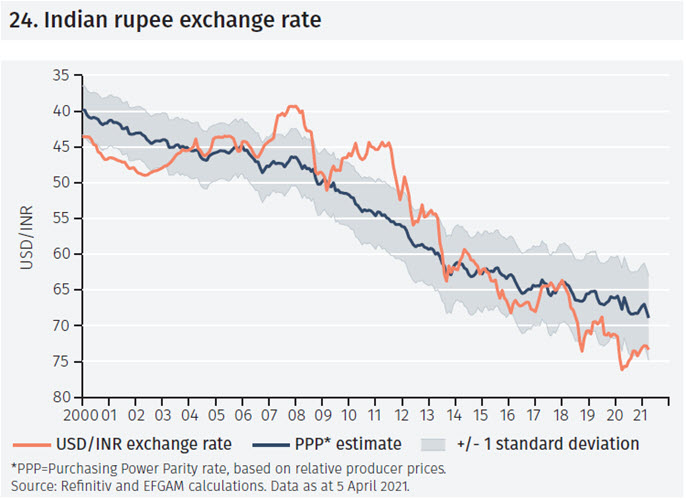
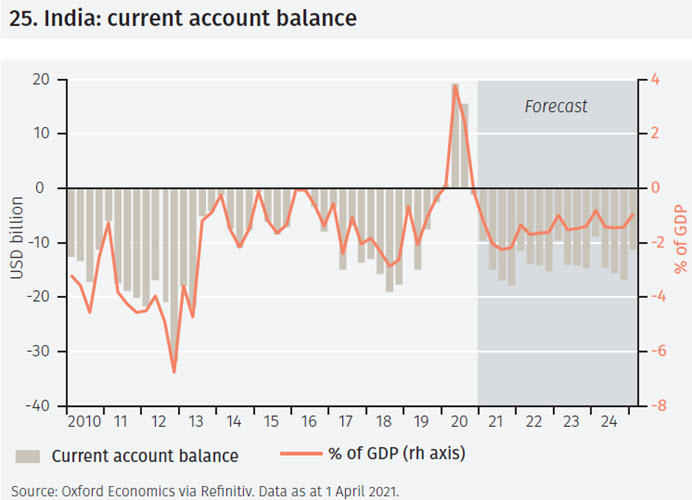
India has historically had a higher inflation rate than the US, with a consequent weakening of its exchange rate over time. Furthermore, India tends to run a current account deficit (see Figure 25) making it vulnerable to sharp currency depreciation when capital outflows increase.
Times change
Times change, of course. India has recently had a current account surplus – lockdowns have restricted oil imports in particular – and deficits are expected to be small in future. Inflation has been contained. Headline and core inflation are both within the Reserve Bank of India’s target (2-6%). Although higher food and oil prices may well lead to higher inflation in the short-run, there is still excess capacity in the economy.
However, a new resurgence of Covid cases and hesitant progress of structural reform remain key concerns.
LATIN AMERICA
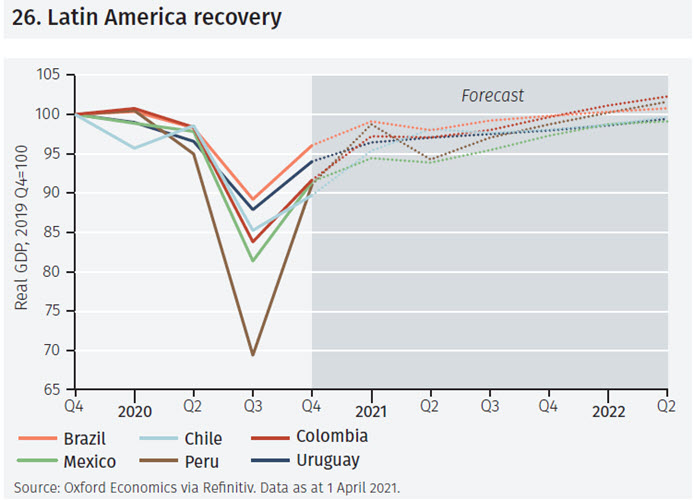
Although there was a recovery in Latin America’s economies in late 2020, progress now looks set to be slow. There are significant obstacles: handling Covid, limited policy flexibility and political uncertainty.
Covid-19 cases and response
Latin America has been hit hard by the Covid-19 pandemic. There were sharp contractions in many economies in 2020; and recoveries are generally expected to be slow (see Figure 26).
Three obstacles
Looking ahead, there are three main obstacles to growth.
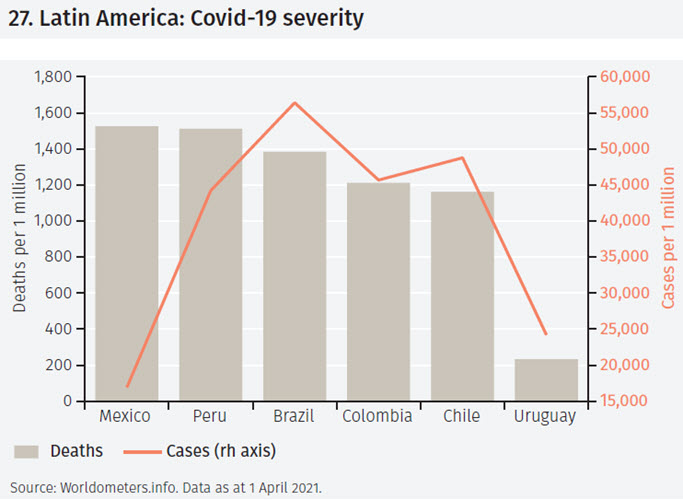
First, Latin America continues to struggle with Covid-19 (see Figure 27). In many economies, notably Brazil, initial denial of its severity has been followed by scepticism about the benefits of vaccination. In the larger Latin American economies, Covid-19 deaths per one million population may be slightly lower than in the US, but this may well be an underestimate of the true picture.6 Less than 10% of the population has been vaccinated in all countries apart from Chile and Uruguay.
Second, political uncertainty has risen ahead of a number of important upcoming elections, such as in Brazil in 2022. President Bolsonaro’s increased intervention in the economy (in particular in relation to fuel prices) stands in sharp contrast to the hoped-for free market reforms of finance minister Paulo Guedes. Delayed by Congress, these have made little progress.
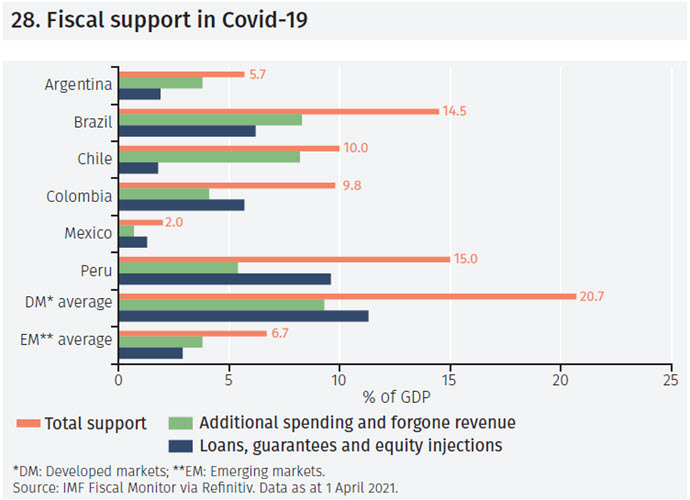
Third, there is little policy flexibility. Across the region, the fiscal response has been smaller than in developed markets and, in the case of Mexico, very small (see Figure 28). High debt levels mean there is little space for further expansion.
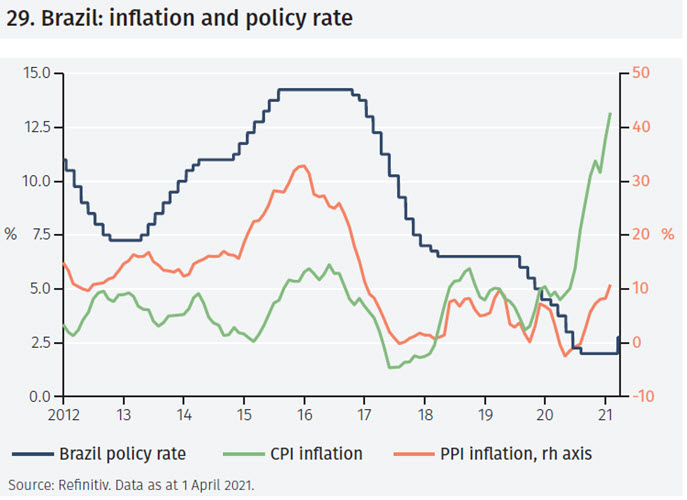
Now, as inflation rises under the influence of higher commodity prices and weaker currencies, there have already been increases in policy interest rates – notably in Brazil (see Figure 29). The road ahead is a difficult one for Latin America.
SPECIAL FOCUS – DIGITAL CURRENCIES
Digital currencies have received much attention recently. Bitcoin, especially, has been in focus as some companies have announced they will take payment in it. But central bank digital currencies are more likely to succeed as a new payment means.
Digital currencies, especially bitcoin, have attracted much recent attention. The term ‘digital currency’ refers to a form of money that is available in electronic form, is stored in applications such as electronic wallets, and is accessible through electronic devices. But bitcoin and central bank digital currencies (CBDCs) are quite different.
Several companies have announced they will take payment in bitcoin, while trials of CBDCs, notably the People’s Bank of China’s e-yuan, are taking place. How are these developments related?
Can bitcoin become money?
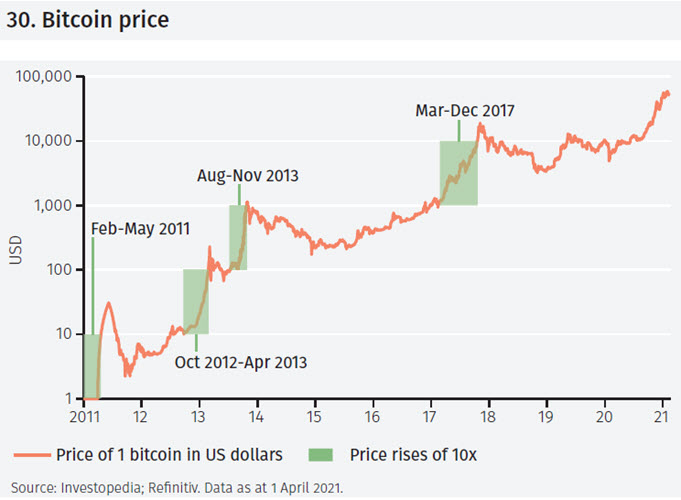
Money has three functions: for making payments, as a store of value and as a unit of account. Acceptance of bitcoin as a means of payment suggests it could satisfy the first of these functions but there are serious issues. Notably, the bitcoin payments mechanism lacks capacity. The upper limit for bitcoin transactions is roughly 5 every second, whereas payment processing companies like Visa or Mastercard can process over 2,000 transactions every second. Bitcoin’s price volatility (see Figure 30) means it is unlikely to be seen as a stable store of value in the short term; and it seems highly unlikely that it would, anytime soon, be used as a unit of account. If it were used in presenting a company’s annual accounts, for example, the price volatility would make year-to-year comparisons of accounts when converted into, say the US dollar, almost meaningless. Bitcoin is also widely associated with illicit transactions and tax evasion, a major reason why it has been outlawed by some countries. Finally, it is not widely accepted as collateral by banks.
One other important contrast between private sector money and CBDCs is their fungibility. Central bank issued money is highly fungible: it can change its representation (from physical notes and coin to a bank deposit to a CBDC, for example) or ownership without impediment. For private digital currencies there is an ongoing debate about their fungibility: bitcoin ownership may be traceable and this may impede its use (say, if a particular bitcoin is held as part of an illegal transaction).
Furthermore, with so many private digital currencies available, the rate at which they can be exchanged between each other is an issue. This is not a new problem. James Bullard, drawing particularly on the US experience when multiple versions of the US dollar circulated, has pointed out that such systems are generally disliked by society.7
However, the fungibility issue is being turned on its head in the art world. Non-Fungible Tokens (NFTs) are now used to represent some artworks. Each NFT is a unique token held on the blockchain. There is only one definitive original version of the artwork. The NFT provides a modern way of ascertaining the provenance of the work. Clearly, this is a technology which could be applied in a far wider context (e.g. the ownership of many types of physical property).
While we agree with Milton Friedman that it is dubious that the private sector can, by itself, provide a stable monetary framework, and that this will remain an essential government function, the technology behind private currencies opens up a new, interesting range of possibilities.
Footnotes
1 The Bloomberg Barclays Global Aggregate Bond Index is a benchmark of government and investment grade corporate debt from developed and emerging markets issuers in 24 countries.
2 Brookings. www.shorturl.at/qvT01
3 The main focus of the UK seems to be on the 11 countries of the Comprehensive and Progressive Agreement for Trans-Pacific Partnership (CPTPP) formed in 2018, which it has applied to join. It has 11 members: Australia, Brunei, Canada, Chile, Japan, Malaysia, Mexico, New Zealand, Peru, Singapore and Vietnam.
4 OECD Interim Economic Outlook Update, March 2021.
5 ‘India’s GDP Misestimation’, Arvind Subramanian, former finance minister. https://bit.ly/3fs4rlF
6 Around 1,500 per 1 million in Brazil, Mexico and Peru compared with over 1,700 in the US. Source: Worldometers, 1 April 2021.
7 James Bullard, Federal Reserve Bank of St Louis, Public and Private Currency Competition. https://tinyurl.com/4ef2n8zw
Important Information
The value of investments and the income derived from them can fall as well as rise, and past performance is no indicator of future performance. Investment products may be subject to investment risks involving, but not limited to, possible loss of all or part of the principal invested.
This document does not constitute and shall not be construed as a prospectus, advertisement, public offering or placement of, nor a recommendation to buy, sell, hold or solicit, any investment, security, other financial instrument or other product or service. It is not intended to be a final representation of the terms and conditions of any investment, security, other financial instrument or other product or service. This document is for general information only and is not intended as investment advice or any other specific recommendation as to any particular course of action or inaction. The information in this document does not take into account the specific investment objectives, financial situation or particular needs of the recipient. You should seek your own professional advice suitable to your particular circumstances prior to making any investment or if you are in doubt as to the information in this document.
Although information in this document has been obtained from sources believed to be reliable, no member of the EFG group represents or warrants its accuracy, and such information may be incomplete or condensed. Any opinions in this document are subject to change without notice. This document may contain personal opinions which do not necessarily reflect the position of any member of the EFG group. To the fullest extent permissible by law, no member of the EFG group shall be responsible for the consequences of any errors or omissions herein, or reliance upon any opinion or statement contained herein, and each member of the EFG group expressly disclaims any liability, including (without limitation) liability for incidental or consequential damages, arising from the same or resulting from any action or inaction on the part of the recipient in reliance on this document.
The availability of this document in any jurisdiction or country may be contrary to local law or regulation and persons who come into possession of this document should inform themselves of and observe any restrictions. This document may not be reproduced, disclosed or distributed (in whole or in part) to any other person without prior written permission from an authorised member of the EFG group.
This document has been produced by EFG Asset Management (UK) Limited for use by the EFG group and the worldwide subsidiaries and affiliates within the EFG group. EFG Asset Management (UK) Limited is authorised and regulated by the UK Financial Conduct Authority, registered no. 7389746. Registered address: EFG Asset Management (UK) Limited, Leconfield House, Curzon Street, London W1J 5JB, United Kingdom, telephone +44 (0)20 7491 9111.
Please use the button below to download the full article.