- Date:
- Author:
- Stefan Gerlach
Infocus - Inflation has surged to levels not seen in decades due to rising commodity prices, supply chain bottlenecks and tight labour markets. These factors apply to most developed countries, but not to Switzerland where inflation remains low. In this edition of Infocus, GianLuigi Mandruzzato compares Swiss inflation to that in the US and the eurozone and draws some policy implications.
With US headline and core inflation remaining far above the Federal Reserve’s 2% objective, much attention is drawn to the recent surge in employment costs. But what factors determine how these have evolved and what is the relative importance of tight labour markets and high inflation? In this issue of Infocus, EFG Chief Economist Stefan Gerlach looks at the data.
Employment costs and the tightness of US labour markets What drives employment costs? To study this question, we look at the Bureau of Labor Statistics Employment Cost Index (ECI). It captures employers’ costs for wages, salaries and a range of different benefits.1 Thus, it captures employment costs broadly.
Figure 1 shows that employment costs were growing at between 3-4% between 2002 (when the data started) and the onset of the financial crisis in 2008. Thereafter, the growth rate of employment costs averaged between 1.5-3% until the second half of 2021, when the cost of labour started to rise rapidly.
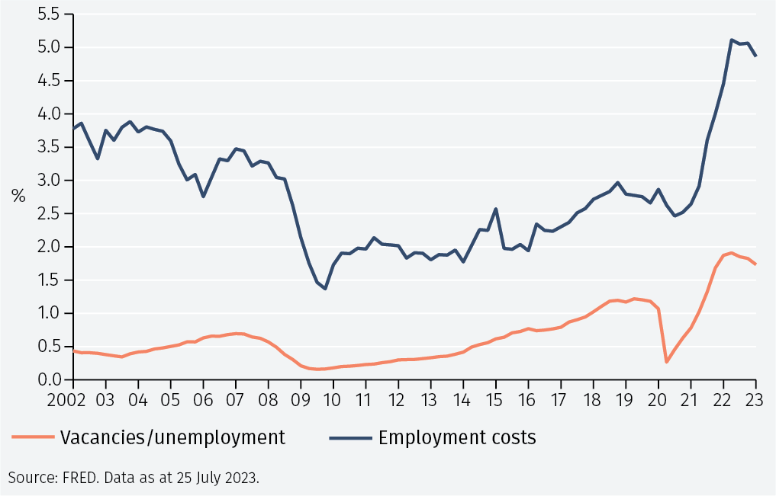
The rise in employment costs reflects in part the tightness of labour markets. Traditionally, this has been measured by the unemployment rate. However, measures capturing both the number of unemployed and the number of job vacancies appear to contain more information about employment cost pressures.
One such variable is the ratio of vacancies to the number of unemployed workers (the V/U ratio). The V/U ratio plays a central role in the transmission of shocks to the labour market and to employment costs. For instance, a boom in the economy or a rise in labour productivity will raise the demand for labour and the number of vacancies and push up employment costs as firms compete for workers.
Figure 1 shows that the V/U ratio moves together with employment costs in a striking manner. It slows after the Global Financial Crisis, then starts to rise gradually before declining sharply as Covid struck in 2020. Since then, it has risen sharply, peaked and started to decline.
The determination of employment costs: empirical evidence
In addition to the tightness of the labour market, much of the current debate about wage increases focuses on workers’ demands for compensation for past inflation. To consider the roles of the V/U ratio and PCE inflation in determining employment costs, we estimate a simple statistical model.2 The model enables us to compute how the growth rate (over four quarters) of employment costs responds to shocks to CPI inflation (also measured over four quarters) and the V/U ratio. Moreover, we can decompose employment costs into the parts due to the different shocks.
Responses to shocks
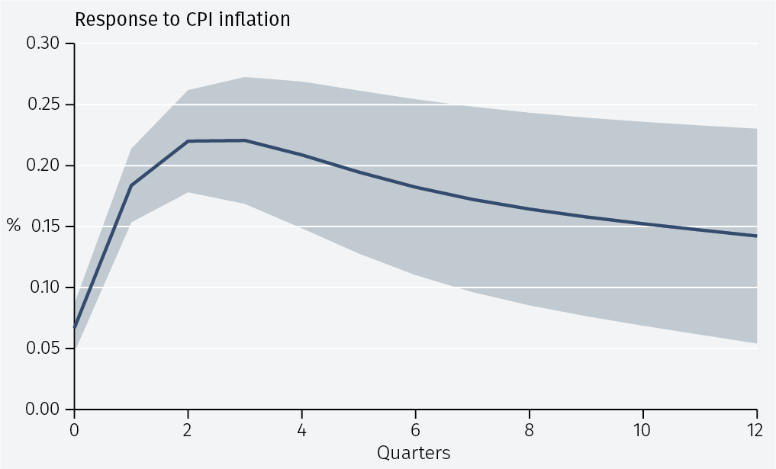
We first look at the responses of employment costs to a one standard deviation unexpected increase (or ‘shock’) to CPI inflation.3 The estimates in Figure 2 show that the growth rate of employment costs rises and peaks about 0.2% higher than the initial level three quarters after the shock, then gradually declines. The effect is long-lasting, reflecting the fact that the growth rate of employment costs is sluggish. 12 quarters later, employment costs are still growing 0.15% faster than when the shock occurred.
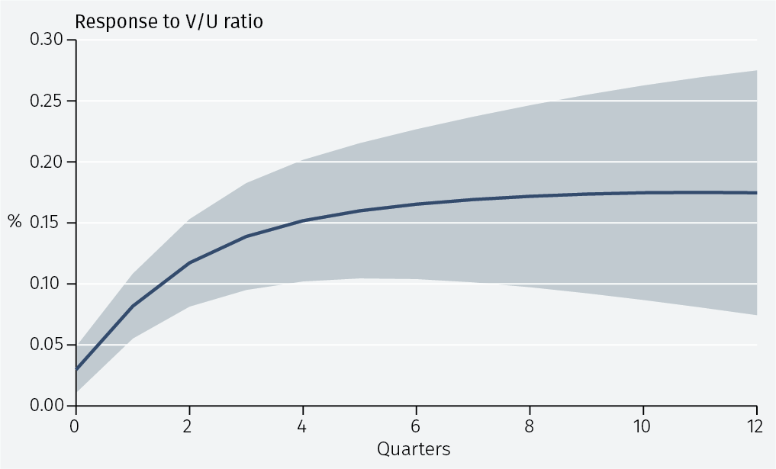
Turning to the responses of the growth rate of employment costs to a one standard deviation large shock in the V/U ratio, the estimate shows a long-lasting and statistically significant response of just less than 0.2% for, at least, 12 quarters after the shock. The reason the response is so protracted is that the V/U ratio evolves only gradually over time.
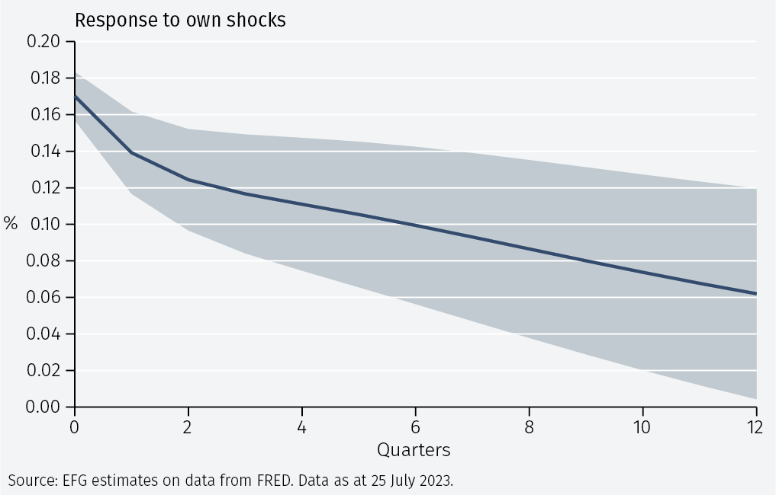
Movements of employment cost growth to its own shocks (that is, movements that cannot be attributed to inflation or the V/U ratio) raise the growth rate of employment costs by about 0.15%. This effect is also highly persistent and significant.
Historical decompositions
Overall, the estimates point to statistically highly significant and persistent responses of the growth rate of employment costs to shocks to inflation and the V/U ratio. Next, we turn to the question of how these shocks have shaped variations in the growth rate of employment costs in the period studied.
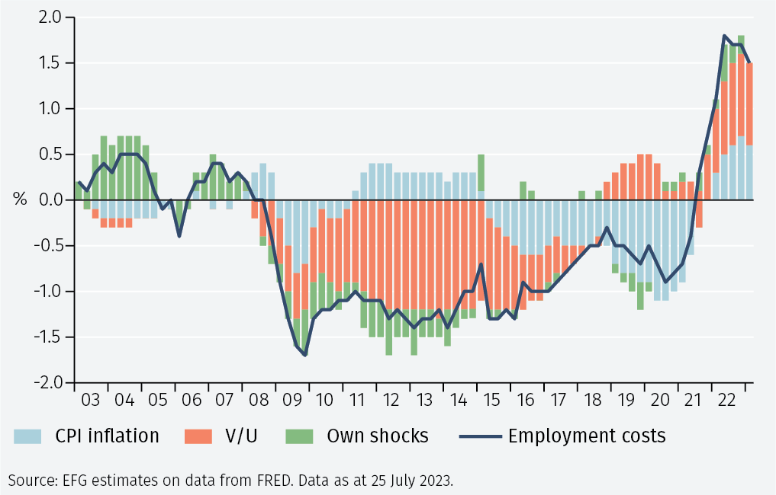
The results shown in Figure 3 indicate the slowdown of employment cost growth after the Global Financial Crisis that started in 2008 was largely due to the decline in the V/U ratio, that is, labour market slack. From 2015 onward, the decline in inflation plays a growing role in lowering employment cost growth. Turning to the recent surge in employment cost growth, the results attribute that to a combination of a tight labour market, as captured by the V/U ratio, and rising inflation.
Own shocks to employment cost growth appear to have played a modest role. The exception is before 2008, when they were the main driver of movements in employment cost growth, pushing it up. In 2009-15, they lowered employment cost growth. They have also provided little upward pressure to labour cost growth during its recent surge.
Variance decompositions
Another way to look at the relative importance of these factors is to look at forecast errors during the sample period and explore whether they are explained by an unexpected movement in inflation, the V/U ratio, or if they cannot be attributed to either of these factors (i.e. they are due to own shocks). This exercise can be repeated for a variety of forecast horizons.
Figure 4 shows the results. Within the quarter, most forecast errors cannot be attributed to movements in inflation or the V/U ratio and are therefore attributed to own shocks. As longer forecasting horizons are considered, the importance of inflation shocks and V/U shocks rise sharply to about 50% and 20%, respectively, at a horizon of four quarters. At a forecast horizon of 12 quarters, the fraction of the forecast error variance that can be attributed to inflation shocks falls to just under 50% while the fraction attributable to V/U shocks rises to just over 1/3.
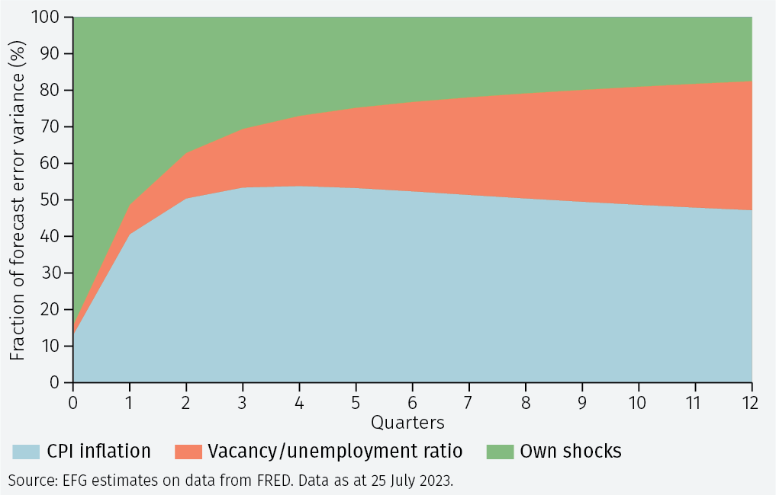
Overall, fluctuation in inflation appears to be the main determinant of movements in employment costs followed by variations in the tightness of labour markets.
Conclusions
The recent surge in employment costs has been a source of unease for the Federal Reserve and market commentators alike. Key questions concern what factors have determined how employment costs have evolved and the relative importance of tight labour markets and high inflation in causing them. The analysis in this report suggests that about half of the movements in employment costs are due to labour market responses to high inflation and a further third to the recent tightness in labour markets. As tighter US monetary policy increasingly impacts the economy, these factors are likely to fade, lowering the growth rate of labour costs and inflation pressures. In turn, that will enable the Fed to start relaxing monetary policy at some future date.
1 These include production bonuses, incentive earnings, commission payments, cost-of-living adjustments, paid leave, overtime pay and pay for working weekends and holidays, insurance benefits, retirement and savings benefits, Social Security, Federal and State unemployment insurance, workers’ compensation insurance and Medicare. See John W. Ruser, ‘The Employment Cost Index: what is it?’ Monthly Labor Review, September 2001, 3-16.
2 We estimate a second-order VAR model on data spanning Q4 2002 – Q1 2023.
3 The VAR model needs to be “identified”, that is, assumptions must be made about the within-the-quarter causal pattern between the variables. If the errors in the VAR model are uncorrelated, then this issue does not arise. In this case, the correlation between the residuals in the employment cost and inflation equation is 0.36. Here it is assumed that, within the quarter, employment costs respond to inflation but not conversely. However, making the opposite assumption leads to a small temporary increase in inflation but a longer-lasting response of employment costs from one quarter onwards. This suggests that the identifying assumption made here is plausible.
Important Information
The value of investments and the income derived from them can fall as well as rise, and past performance is no indicator of future performance. Investment products may be subject to investment risks involving, but not limited to, possible loss of all or part of the principal invested.
This document does not constitute and shall not be construed as a prospectus, advertisement, public offering or placement of, nor a recommendation to buy, sell, hold or solicit, any investment, security, other financial instrument or other product or service. It is not intended to be a final representation of the terms and conditions of any investment, security, other financial instrument or other product or service. This document is for general information only and is not intended as investment advice or any other specific recommendation as to any particular course of action or inaction. The information in this document does not take into account the specific investment objectives, financial situation or particular needs of the recipient. You should seek your own professional advice suitable to your particular circumstances prior to making any investment or if you are in doubt as to the information in this document.
Although information in this document has been obtained from sources believed to be reliable, no member of the EFG group represents or warrants its accuracy, and such information may be incomplete or condensed. Any opinions in this document are subject to change without notice. This document may contain personal opinions which do not necessarily reflect the position of any member of the EFG group. To the fullest extent permissible by law, no member of the EFG group shall be responsible for the consequences of any errors or omissions herein, or reliance upon any opinion or statement contained herein, and each member of the EFG group expressly disclaims any liability, including (without limitation) liability for incidental or consequential damages, arising from the same or resulting from any action or inaction on the part of the recipient in reliance on this document.
The availability of this document in any jurisdiction or country may be contrary to local law or regulation and persons who come into possession of this document should inform themselves of and observe any restrictions. This document may not be reproduced, disclosed or distributed (in whole or in part) to any other person without prior written permission from an authorised member of the EFG group.
This document has been produced by EFG Asset Management (UK) Limited for use by the EFG group and the worldwide subsidiaries and affiliates within the EFG group. EFG Asset Management (UK) Limited is authorised and regulated by the UK Financial Conduct Authority, registered no. 7389746. Registered address: EFG Asset Management (UK) Limited, Park House, 116 Park Street, London W1K 6AP, United Kingdom, telephone +44 (0)20 7491 9111.