- Date:
Infocus - Concerns over inflation have recently come to the forefront for investors.
Concerns over inflation have recently come to the forefront for investors. In this edition of Infocus, EFG’s Chief Economist Stefan Gerlach conducts a forensic examination of inflation and uses historical data to highlight the difference between shocks and longer-term trends.
The recent sharp increase in inflation across the world has raised investors’ concerns about the outlook for monetary policy. Will inflation fade away in the coming quarters on its own? Or will central banks realise that they have fallen behind the curve and tighten monetary policy to get back on track? Might that trigger a recession? Or difficulties in servicing debt among over-extended firms, household and even governments? The stakes are high.
To think about these issues, it is useful to take a step back and consider what economists mean by inflation.
Defining inflation
Most people think of inflation as the percentage change in some price index over twelve months. Economists, by contrast, define inflation as a process of continuously rising general prices.1 For instance, the Merriam-Webster dictionary defines it as “a continuing rise in the general price level” and Dictionary.com views it as “a persistent, substantial rise in the general level of prices.”
Two aspects of these definitions are important.
- They refer to the general level of prices. Price increases that are restricted to a limited number of goods and services do not constitute inflation. To assess general inflationary conditions, economists use some broad index, typically a consumer price index (CPI), but sometimes other indices – such as retail price indices, or a consumption or GDP deflator – are used.
- Inflation is an ongoing process of price increases. A oneoff increase in some price, however important, that raises the level of the CPI does not constitute inflation although it will lead to a transitory boost to the rate of increase in prices. Such price level shocks can come from a variety of factors, including energy and commodity prices; exchange rate movements; and changes in indirect taxes and administratively set prices for public services (such as train tickets) or subsidies.
Inflation as an “ongoing process of price increases”
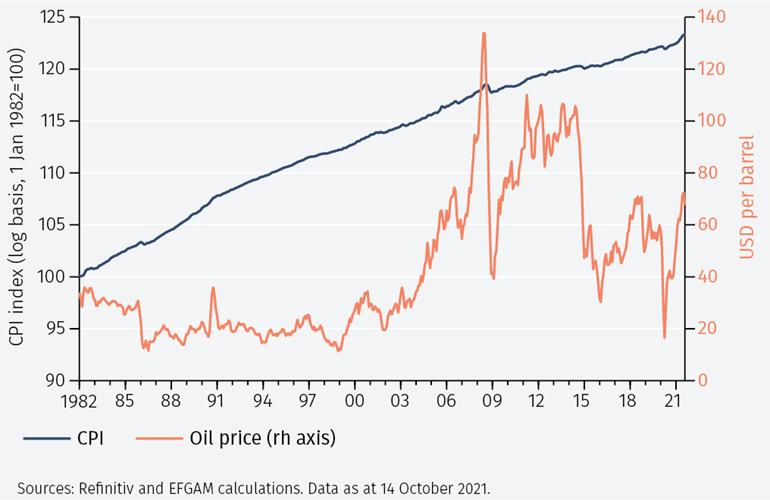
Figure 1 plots the CPI, indexed to 100 in 1982 and the price of WTI oil in USD per barrel, which attracts particular attention when discussing inflation. The CPI rises smoothly. Since the slope of the CPI line measures inflation, the figure suggests that the CPI captures inflation very well.2
The figure also shows that oil prices do not rise gradually in the same way as the CPI but rather fluctuate around fixed levels that occasionally change. For instance, while oil prices fluctuated around 20 dollars per barrel between 1982 and 2005, since 2005 they have fluctuated around 60 dollars per barrel. Changes in oil prices are thus best thought of as price level shocks, that at most have temporary direct effects on inflation: after the oil price has reached a new level, inflation returns to its previous level.3
The distinction between price level shocks and inflation is of huge practical importance for central banks. Since monetary policy only affects inflation with “long and variable lags”, as the Nobel Laureate Milton Friedman put it, it makes little sense to change policy in response to a price level shock because it will have dissipated long before the policy change starts to impact on the economy.
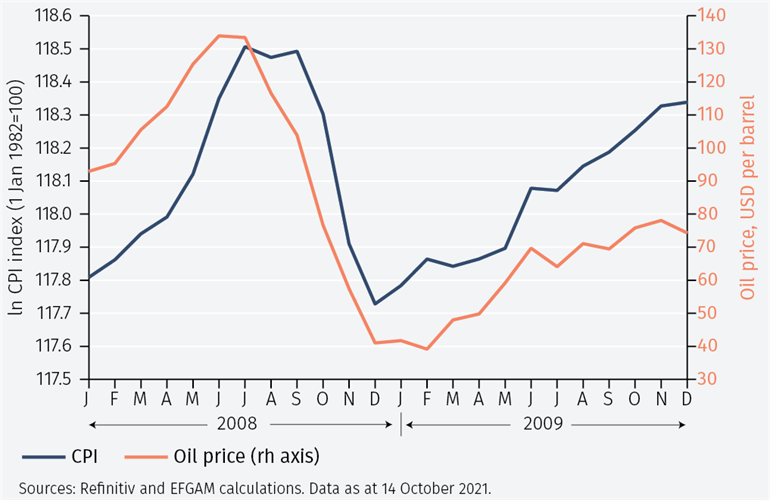
While Figure 1 suggests that the slope of the CPI line is smooth and that there is little relationship between the two series, looking more closely at shorter time periods shows that this is not always the case (see Figure 2). For instance, the period January 2008 – December 2009 shows large fluctuations in both the CPI and oil prices. Between January and July 2008, the CPI rose 3.2% as oil prices rose 43.6%; and between July and December the same year the CPI fell by 3.5% as oil prices collapsed by 69.3%.
The figure shows that price level shocks can have a large impact on the CPI. The occurrence of price level shocks thus implies that computing the percentage change in the CPI is unlikely to provide a clear view of the “ongoing process of price increases” that constitutes inflation. How can these shocks be removed?
An excursion: global warming
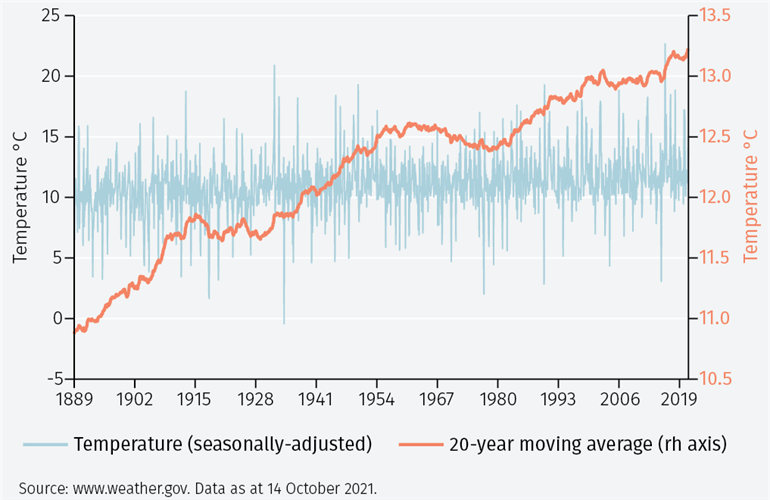
The problem of assessing inflation is not too different from the problem of determining whether the world is heating up. Figure 3 shows seasonally adjusted monthly data for the period 1889-2020 from the National Weather Service on the temperature measured at the Arsenal Building on 5th Ave (between 63rd & 64th) in Central Park.4
Looking at the monthly temperature alone makes it difficult to assess whether the temperature has been increasing continuously as any change in the trend is dwarfed by random monthly fluctuations. This is precisely the same problem as judging inflation, properly defined as an “ongoing process of price increases,” by merely looking at the price changes.
Computing a 20-year average of the temperature and plotting this on a separate axis shows that the average temperature rose from 10.9C in the 20-year period ending in January 1889 to 13.2C in the period ending in December 2020. Thus, a simple transformation of the data is often helpful for judging trend changes. Of course, while this 240-month average is a good indicator of the temperature trend, it is not necessarily a good indicator of what the temperature is now.
Assessing inflation in real time
Returning to inflation, how can one obtain a measure of the trend increase in prices in real time? One way to do so is to measure the general level of prices using ‘core inflation’, that is, using the CPI but disregarding the volatile food and energy components. Another possibility is to use the measure of median inflation intended to capture the trend of prices published by the Federal Reserve Bank of Cleveland.5 It can be constructed by computing the monthly percent change of all the components of the CPI, ranking them in order from high to low and selecting the middle one.6
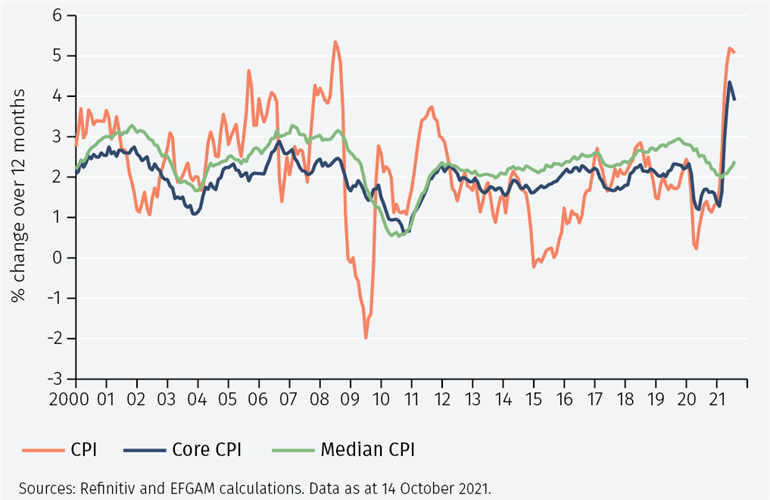
Figure 4 shows percentage changes over 12 months of the CPI, core CPI and median CPI. It is readily apparent that the core CPI is much more stable than the CPI itself. However, the median CPI is the most stable. All measures of inflation fluctuated around 2-3% in the run-up to the Global Financial Crisis and fell sharply afterward, reaching a bottom in 2010 of between 0-1%. They then recovered and continued to fluctuate between 2-3%.
What do core and median inflation have to say about recent CPI inflation? Between 2011 and 2019 median inflation rose gradually from 2% to almost 3%. The Fed began tapering bond purchases in early 2014, started to increase interest rates in late 2015 and raised them progressively until the summer of 2019, when the weakening economy led it to cut rates. Since inflation lags the business cycle, inflation subsequently fell.
Turning to the current situation, the figure shows that while the CPI and core CPI rose sharply in recent months before peaking, the median inflation has risen more modestly. This illustrates how median inflation is a useful complement to CPI inflation in analysing price pressures and is one reason why many economists and central banks are not overly worried about the recent uptick in prices. Nevertheless, rising median inflation is one more factor motivating a shift towards tighter monetary policy in the US.
Conclusions
In understanding the outlook for prices and for monetary
policy, it is essential to distinguish between price level shocks
and continuing increases in prices, and between increases
in a few specific prices versus increases in the price index
more broadly. While this is never an easy task, attempts to
do so using the Cleveland Fed’s measure of median inflation
suggests that the recent increase in the rate of change of CPI
does not provide firm evidence that the outlook for inflation
beyond the next few quarters has materially changed.
1 For a discussion, see David Laidler and Michael Parkin, ‘Inflation: A Survey’, Economic Journal, 1975, 85, 741-809.
2 To clarify the relationship between the slope of the line and inflation, note that the ratio between the price level at time 1 and 2 equals one plus the rate of inflation, π: P2/P1 = 1 + π. Taking the log of this expression yields p2-p1 ≈ π (since ln (1 + x) ≈ x when x is close to zero). Since the log of the price index is plotted, it follows that the difference between two points in the line captures the rate of inflation.
3 Of course, if inflation is measured over 12 months, it will take 12 months for inflation to stabilise.
4 See https://www.weather.gov/okx/CentralParkHistorical
5 This measure is less likely to be influenced by disturbances in individual prices but will of course be sensitive to shocks that affect all prices, such as changes in indirect taxes.
6 Or the average of the two in the middle if the number is even.
Important Information
The value of investments and the income derived from them can fall as well as rise, and past performance is no indicator of future performance. Investment products may be subject to investment risks involving, but not limited to, possible loss of all or part of the principal invested.
This document does not constitute and shall not be construed as a prospectus, advertisement, public offering or placement of, nor a recommendation to buy, sell, hold or solicit, any investment, security, other financial instrument or other product or service. It is not intended to be a final representation of the terms and conditions of any investment, security, other financial instrument or other product or service. This document is for general information only and is not intended as investment advice or any other specific recommendation as to any particular course of action or inaction. The information in this document does not take into account the specific investment objectives, financial situation or particular needs of the recipient. You should seek your own professional advice suitable to your particular circumstances prior to making any investment or if you are in doubt as to the information in this document.
Although information in this document has been obtained from sources believed to be reliable, no member of the EFG group represents or warrants its accuracy, and such information may be incomplete or condensed. Any opinions in this document are subject to change without notice. This document may contain personal opinions which do not necessarily reflect the position of any member of the EFG group. To the fullest extent permissible by law, no member of the EFG group shall be responsible for the consequences of any errors or omissions herein, or reliance upon any opinion or statement contained herein, and each member of the EFG group expressly disclaims any liability, including (without limitation) liability for incidental or consequential damages, arising from the same or resulting from any action or inaction on the part of the recipient in reliance on this document.
The availability of this document in any jurisdiction or country may be contrary to local law or regulation and persons who come into possession of this document should inform themselves of and observe any restrictions. This document may not be reproduced, disclosed or distributed (in whole or in part) to any other person without prior written permission from an authorised member of the EFG group.
This document has been produced by EFG Asset Management (UK) Limited for use by the EFG group and the worldwide subsidiaries and affiliates within the EFG group. EFG Asset Management (UK) Limited is authorised and regulated by the UK Financial Conduct Authority, registered no. 7389746. Registered address: EFG Asset Management (UK) Limited, Leconfield House, Curzon Street, London W1J 5JB, United Kingdom, telephone +44 (0)20 7491 9111.