- Date:
The Hong Kong dollar (HKD) peg to the US dollar (USD) is regularly called into question. While the risk in principle is in either direction, concerns have focussed on the possibility of the Hong Kong Monetary Authority (HKMA) being forced to let the currency weaken beyond 7.85 HKD/USD. In this issue of Infocus, EFG chief economist Stefan Gerlach reviews market pricing and comes to some interesting conclusions.
Introduction
The credibility of Hong Kong’s currency board that pegs the HKD to the USD is often a concern for investors. Despite speculation over the years that it may be abandoned, leading the HKD to depreciate against the USD, it has remained unchanged, except for minor technical improvements, since its introduction in October 1983, almost 40 years ago. From the perspective of monetary history, that is a remarkable achievement.
While commentators have typically focused on the risk of a weakening of the HKD, the risk is in principle in both directions, although the HKMA can sell HKD in unlimited amounts to prevent an appreciation. Sustained high growth in China coupled with the opening of its financial system may lead the HKMA at some future stage to switch the peg to the renminbi. If so, the HKD could hypothetically appreciate against the USD.
Focusing on the risk of a depreciation, some back-of-theenvelope calculations illustrate that the fact the currency board is still in place after so many years implies that the likelihood the peg will be overrun must be very low, at least if the past is a guide to the future. Figure 1 below shows the probability of the peg collapsing either not at all or once or twice over the last 38 years, assuming the probability in any one year of it being broken is 5%, 1% or 0.5%.
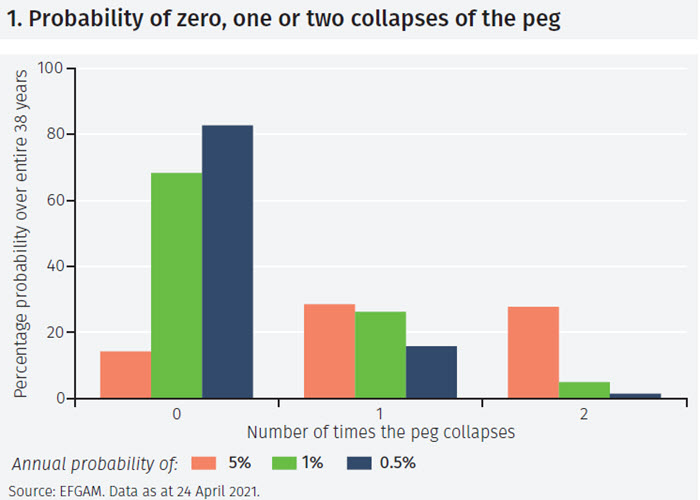
If the annual risk is 5%, the likelihood that it would survive unchanged for 38 years is only about 15% (the orange column at the extreme left of Figure 1). In fact, it is four times as likely that it would have collapsed once or twice. Plainly, the likelihood that the peg will collapse must be much smaller than 5% per year.
If the likelihood that the peg is overrun is 1% per year, then the probability of it operating for 38 years without a collapse is about two-thirds and the probability of one collapse is more than one quarter. While that makes the current outcome more likely than a collapse, it nevertheless implies that luck has been important for sustaining the currency board. That seems a little unlikely.
Assuming an annual risk that the peg is overrun of 0.5% implies that the probability it would have survived for 38 years is over 80%. However, the probability of one collapse is about 16% or 1/6, suggesting a not entirely unlikely possibility.
Different people will draw different conclusions from this simple analysis. However, most would probably argue that the historical evidence suggests the likelihood the peg will be overrun over a twelve-month period is at most 1%, and probably much less than that.
Assessing the credibility of the peg
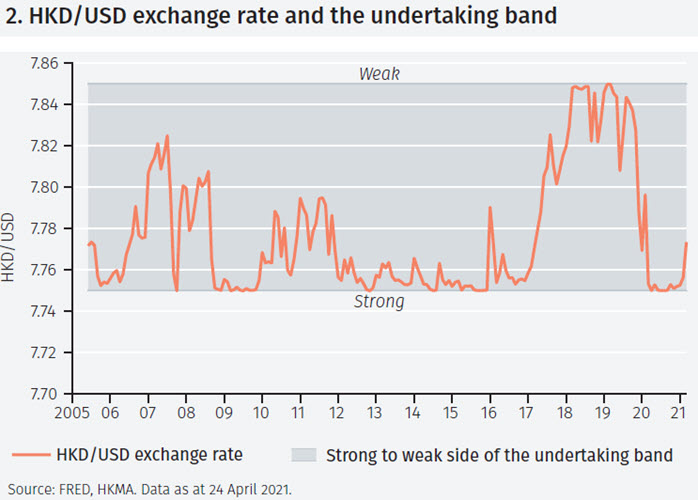
But how can the credibility of the peg be evaluated at any point in time? One natural way of doing so is to plot the exchange rate against the band defined by the ‘strong-side’ undertaking at 7.75 HKD/USD and the ‘weak-side’ undertaking at 7.85 HKD/USD. Figure 2 shows the evolution of the exchange rate against this band since the establishment of the strong side undertaking in the summer of 2005.
The figure shows that the exchange rate was often close to either of the two limits. It was close to the strong-side undertaking for a large part of the period considered, except from March 2018 to October 2019 when it was close to the weak-side undertaking. However, while interesting, the figure provides little information about market expectations of the viability of the peg.
To assess the credibility of the currency board, a simple technique can be used.1 The test, which is explained in detail in the Appendix, involves computing the range around the USD interest rate for a given maturity that is compatible with the currency board remaining in force. Investors will only be willing to borrow or lend at HKD interest rates outside that range if they believe that the peg may collapse during the period defined by the maturity of the interest rate considered.
The upper end of the range is given by the USD interest rate, plus the gain from holding USD assets if the HKD depreciates as much as is allowed under the currency board, that is, to 7.85 HKD/USD; the lower end is given by the USD interest rate, minus the loss incurred if the HKD appreciates as much as is allowed, that is, to 7.75 HKD/USD.
The extent of gain or loss depends on where exactly the exchange rate is in the 7.75 – 7.85 HKD/USD band. If it is at the middle of the band, at 7.80 HKD, then the exchange rate gain from holding USD assets will be 0.64% if it depreciates to 7.85 HKD. Similarly, the loss will be 0.64% if it appreciates to 7.75 HKD. This defines a range around the USD interest rate that is compatible with investors being sure that the currency board will continue to operate.
The maturity of the interest rate considered will matter for the width of the interest rate range. If the maturity of interest rates considered is 12 months, the range will be given by the US interest rate ±0.64%. If instead 10-year yields are used, the range will be narrower and equal to the US 10-year yield ±0.06%.2 It follows that the test is more powerful if longer term interest rates are considered.
Before turning to the results, it is worth highlighting that the analysis assumes investors can borrow and lend at these interest rates or yields and that there is no default risk premium. The limits of the interest rate range are only approximate if that is not the case.
The perspective of 12-month interest rates
Figure 3 plots the upper and lower limits of the interest rate corridor, together with the 12-month Hong Konk interbank offered rate (Hibor) for the period June 2005 (when a “strong side” undertaking of 7.75 HKD was introduced and the “weak side” undertaking was moved to 7.85 HKD) to March 2021. Between 2005 and 2010, the HKD interest rate was below the range, indicating that investors believed the HKD might strengthen above 7.75 HKD. The cause of this was the appreciation of the renminbi against the USD from the summer of 2005 onward, which fuelled speculation that the HKD peg might be switched to the renminbi and lead to an appreciation of the HKD against the USD. This illustrates the two-sided risk to the HKD peg.
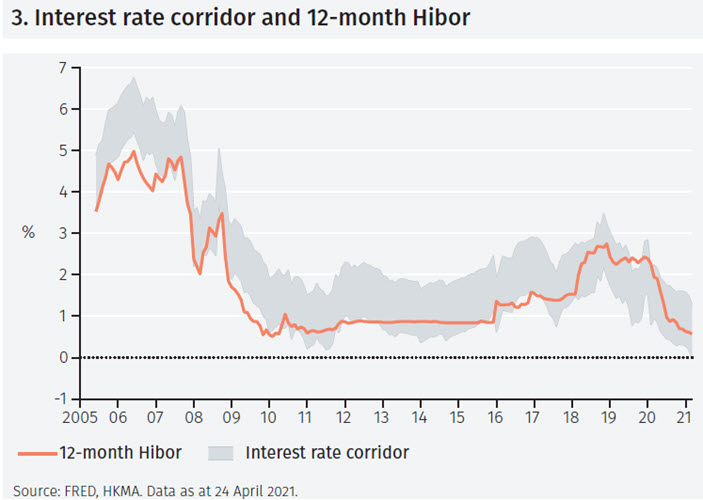
Between 2010 and 2017, the 12-month Hibor rate was generally just inside the range, implying that investors believed the peg would remain unchanged. But in August-November 2019 and in February 2020, the Hibor rate rose briefly above the upper limit of the interest rate range, implying that some investors grew concerned that the peg might collapse. However, it recovered quickly and is now well inside the range.
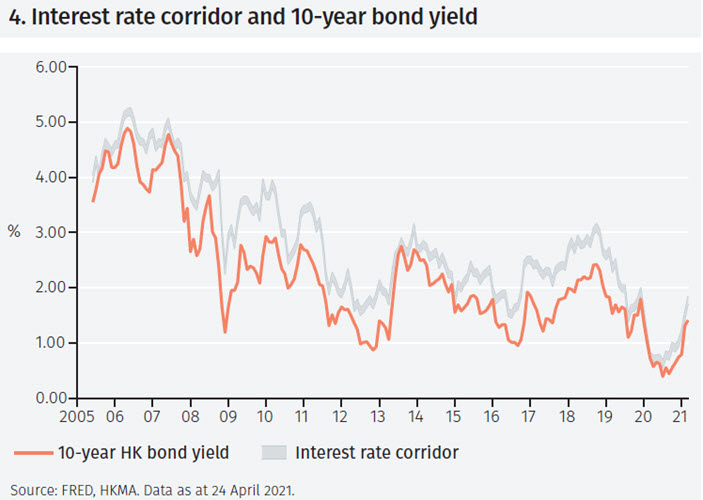
The perspective of 10-year yields
Figure 4 overleaf shows the same calculation, but using 10- year yields. The interest rate range is much narrower in this case, for the reasons explained above.
Interestingly, the 10-year HKD yields are in this case always below the range, except in March 2020 when they are just inside the range. This suggests that market participants attached little weight to the risk of the currency board being broken. However, it is compatible with the idea that the HKMA might decide to switch the peg to the renminbi, potentially leading to an appreciation of the HKD against the USD.
Conclusions
There are two main conclusions of the analysis. First, with the currency board having remained unchanged for 38 years, it is clear that the likelihood of a collapse of the peg must on average have been very low, perhaps a fraction of a percent per annum. Had the probability been materially higher, one would have expected to see one or several episodes in which the currency board was overrun. Second, the HK dollar peg appears highly credible to market participants. If anything, a strengthening of the HKD above 7.75 HKD seems more likely than a weakening below 7.85 HKD, as evidenced by the fact that the HKD 10-year yield has been persistently below the range implied by the analysis above.
Such an appreciation of the HKD is compatible with the peg being switched from the USD to the renminbi, and the latter appreciating against the USD. While such a switch seems unlikely in the near term, from an historical and political perspective it remains a possibility in the more distant future.
Footnotes
1 See Lars Svensson, ‘The simplest test of target zone credibility’, IMF Staff Papers, 1991, 655-665.
2 With the maximal exchange rate adjustment being 0.64%, the exchange rate can move by (on average) at most 0.064% per annum.
Important Information
The value of investments and the income derived from them can fall as well as rise, and past performance is no indicator of future performance. Investment products may be subject to investment risks involving, but not limited to, possible loss of all or part of the principal invested.
This document does not constitute and shall not be construed as a prospectus, advertisement, public offering or placement of, nor a recommendation to buy, sell, hold or solicit, any investment, security, other financial instrument or other product or service. It is not intended to be a final representation of the terms and conditions of any investment, security, other financial instrument or other product or service. This document is for general information only and is not intended as investment advice or any other specific recommendation as to any particular course of action or inaction. The information in this document does not take into account the specific investment objectives, financial situation or particular needs of the recipient. You should seek your own professional advice suitable to your particular circumstances prior to making any investment or if you are in doubt as to the information in this document.
Although information in this document has been obtained from sources believed to be reliable, no member of the EFG group represents or warrants its accuracy, and such information may be incomplete or condensed. Any opinions in this document are subject to change without notice. This document may contain personal opinions which do not necessarily reflect the position of any member of the EFG group. To the fullest extent permissible by law, no member of the EFG group shall be responsible for the consequences of any errors or omissions herein, or reliance upon any opinion or statement contained herein, and each member of the EFG group expressly disclaims any liability, including (without limitation) liability for incidental or consequential damages, arising from the same or resulting from any action or inaction on the part of the recipient in reliance on this document.
The availability of this document in any jurisdiction or country may be contrary to local law or regulation and persons who come into possession of this document should inform themselves of and observe any restrictions. This document may not be reproduced, disclosed or distributed (in whole or in part) to any other person without prior written permission from an authorised member of the EFG group.
This document has been produced by EFG Asset Management (UK) Limited for use by the EFG group and the worldwide subsidiaries and affiliates within the EFG group. EFG Asset Management (UK) Limited is authorised and regulated by the UK Financial Conduct Authority, registered no. 7389746. Registered address: EFG Asset Management (UK) Limited, Leconfield House, Curzon Street, London W1J 5JB, United Kingdom, telephone +44 (0)20 7491 9111.