- Date:
Insight Q3 2020
OVERVIEW
The shock to the world economy as a result of the Covid-19 pandemic will bring lasting changes. Some will reinforce pre-existing trends; others will be new, largely unforeseen just a few months ago.
Stock market rebound
The drop in global stock markets as a result of the Covid-19 outbreak, and the speed of the recovery, have been exceptional. In the US, the S&P 500 index dropped by almost one third between late February and late March; but by August 2020 had recovered all that lost ground. Recoveries after similarly sharp declines have taken much longer in the past (see Figure 1).
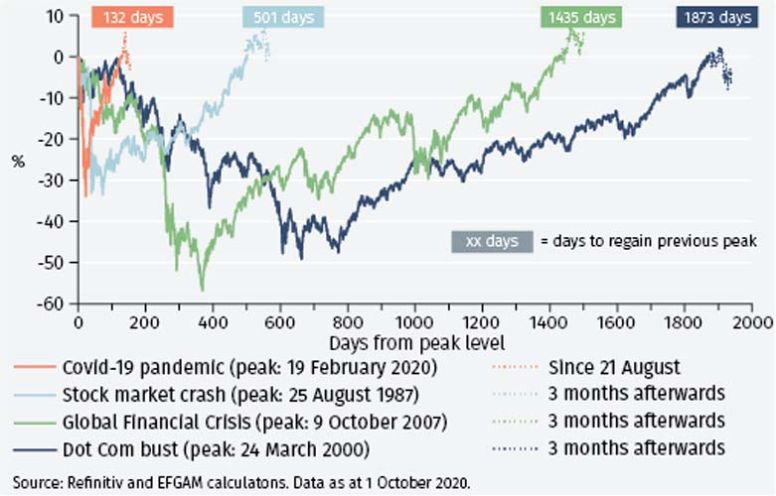
As the stock market is often a leading (albeit somewhat unreliable) indicator of the economy, a rising market can be seen as an encouraging sign of a rebound in activity. Some indicators – such as consumer spending in many economies – are in line with hopes of a V-shaped recovery. Others – international travel, for example – remain depressed. And, more fundamentally, it is now clear that the world has changed in a number of important respects.
China: the bubble that never pops
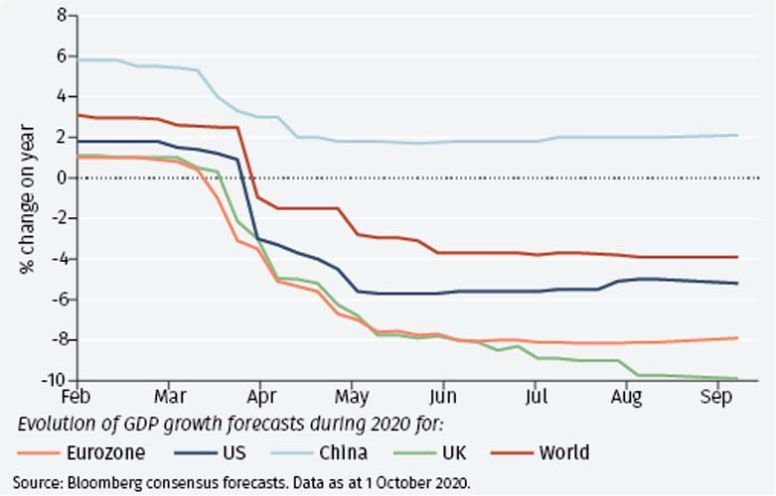
Several pre-existing trends have been reinforced. One of these is the importance of China for global economic growth. Much to the frustration of many in the west, China has recovered from the Covid-19 outbreak far more successfully than any other major economy. In 2020, China will be one of the very few countries showing positive real GDP growth (see Figure 2). This follows many years in which the durability and resilience of China’s economy has been questioned. In 2007, China’s premier Wen Jiabao argued that “the biggest problem with China’s economy is that growth is unstable, unbalanced, uncoordinated and unsustainable”. Yet, first, in response to the global financial crisis and, now, in response to Covid-19, China has successfully navigated a course to continued growth.
It has avoided a crash in the property market, which many feared would be caused by excess leverage. It has reduced its excessive current account surplus, which is now close to balance. It has eradicated rural poverty. Inflation has remained well controlled and the currency has been stable. China is “the bubble that never pops” according to one new analysis.1 Bubbles can persist when an economy’s nominal growth rate (taking into account real growth and inflation) consistently exceeds its nominal interest rate. That is the case for China now; has been for many years; and looks set to continue in the future.
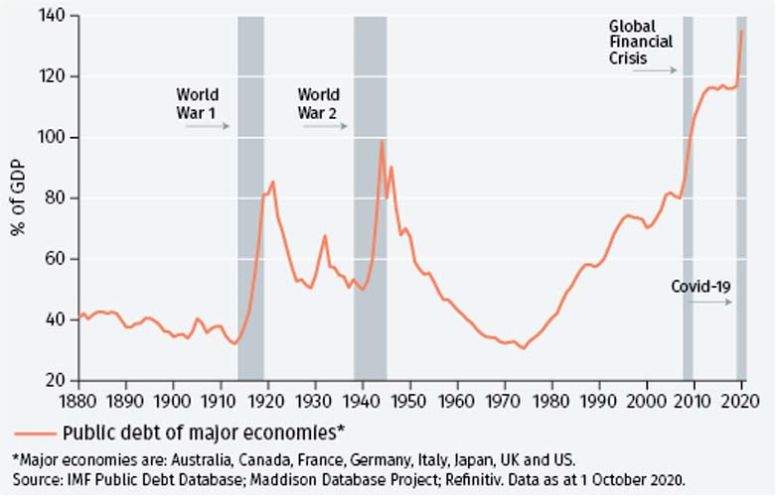
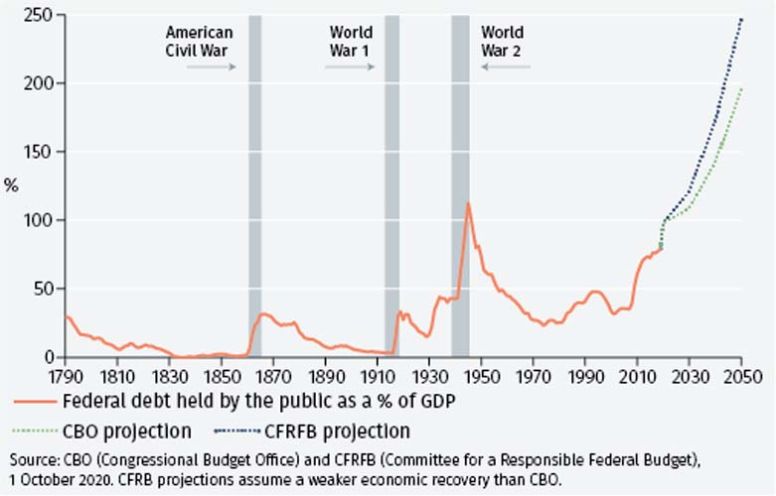
A sudden surge in government debt
An unexpected, sudden development has been the increase in government debt levels because of the measures taken to counter the pandemic. Across the major developed economies, debt has surged to above 100% of GDP (see Figure 3). However, an analysis similar to that of China’s broad economic sustainability can be applied to government debt. That is, if the interest rate paid on government debt is sufficiently below the nominal growth rate of the economy, debt levels can be stabilised and even fall.2 This has happened before. After World War II, advanced economies’ average debt levels fell from 90% to 30% of GDP, largely due to stronger nominal growth. Interest rates in the advanced economies are now very low, and we think will remain low for some time; so that means the key issue is whether robust growth in real GDP and inflation can be generated.
Action on climate change
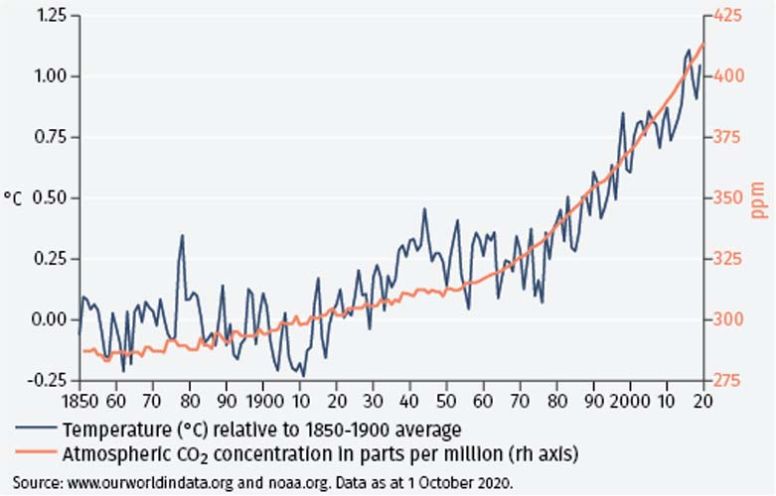
One way of boosting growth would be to target substantial public and private investment towards tackling climate change. From Australian and Californian wildfires, melting Siberian permafrost and a record Atlantic hurricane season, the urgency of such action has been reinforced. The link between rising global greenhouse gas levels and global warming (see Figure 4) is clear; and that this is causation not correlation is now widely accepted.
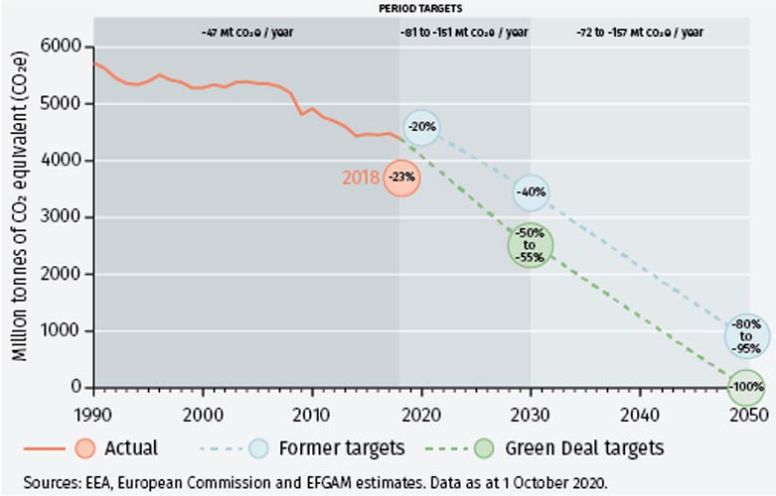
The EU’s Green Deal, that seeks to cut EU carbon emissions by 95% by 2050 (see Figure 5) is one example of the targets that have been set. China is now committed to carbon neutrality (i.e. having no net carbon dioxide emissions) by 2060. Many US states and cities have embraced such measures. Encouragingly, the costs of new technology to curb emissions – especially solar and wind power and electric vehicle technology – have fallen sharply. One estimate is that aggressively pursuing all of the low-cost opportunities currently available to curb carbon emissions would cost ‘only’ €200-350 billion each year up until 2030.3 Given that global fiscal support to fight Covid-19 is put at US$9tr, such costs may now seem more acceptable.
Inequality
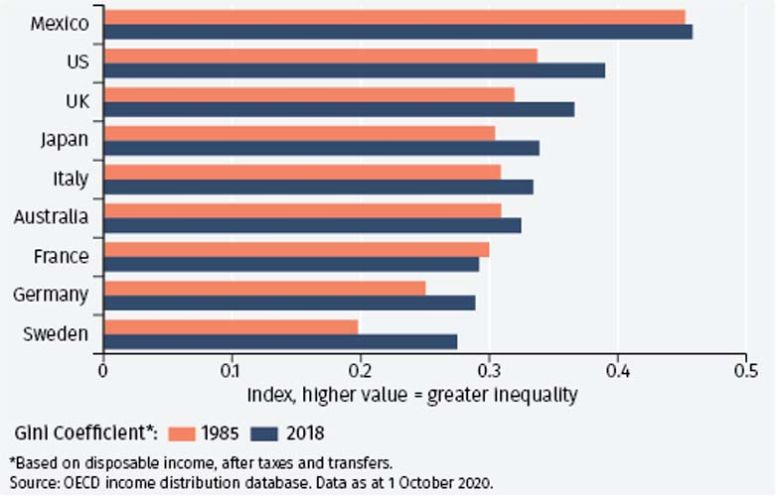
Rising inequality of income has been a feature of most developed economies in recent decades (see Figure 6). Perhaps the most important reason is that increased globalisation meant lower-paid workers in China, emerging Asia and eastern Europe undercut the incomes and job prospects of lower-skilled workers in the west. As wage rates in those developing economies have risen and deglobalisation forces have taken hold, pressures on the low paid in developed economies may now be waning. This may help sectors of society that have been notable losers from previous trends. It is notable that unemployment, especially for the young, black and Hispanic US population, peaked at rates above 30% in the pandemic. The US Fed’s new emphasis on achieving the maximum sustainable level of employment may well help the employment and income prospects of such disadvantaged sectors.
We believe it may be difficult to get back to pre-pandemic conditions.
ASSET MARKET PERFORMANCE
In the third quarter of 2020, global equity markets continued to make gains after the strong second quarter recovery. Global bonds and equities registered positive returns for the year to end-September.
Asset market performance
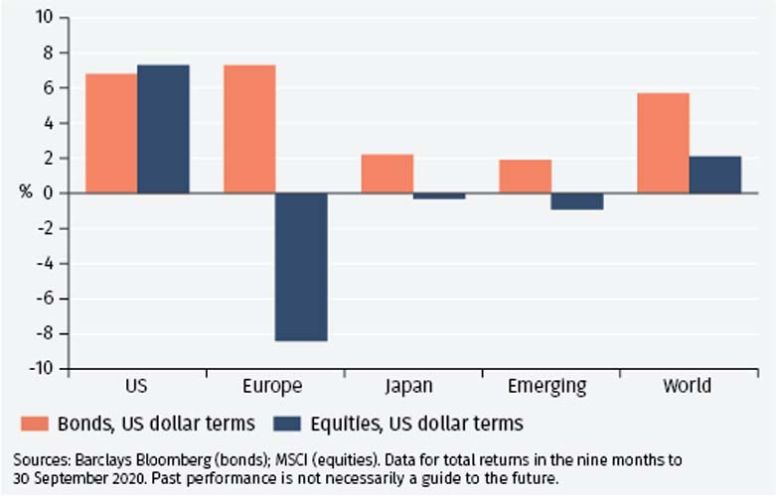
World equity markets saw gains of 2.1% in the first three quarters of 2020 (see Figure 7) on the basis of the MSCI World Index in US dollar terms. Those gains reflected a continued modest recovery in the third quarter of the year after the strong rebound in the second quarter. Global bond market returns were higher, at 5.7%, on the basis of the Bloomberg Barclays Global Aggregate Index.4 Returns from US bonds (measured by the Bloomberg Barclays US Aggregate Index) were 6.8% and from European bonds slightly higher, at 7.3%. Emerging market bonds, recovering after the poor performance in the first quarter, recorded positive year-to-date US dollar returns by the end of the third quarter.
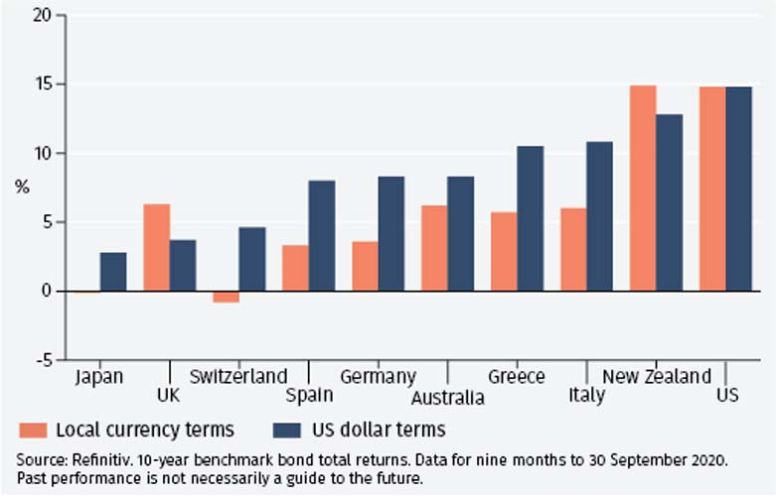
Bond markets
With the general decline in yields across all maturities, longer dated bonds generally produced higher total returns in the first three quarters of the year. The total return from US 10-year government bonds was as high as 14.8% in that period (see Figure 8), for example. Local currency returns across eurozone government 10-year maturity bonds ranged from 3.3% in Spain to 6% in Italy. Returns in US dollar terms, boosted by the euro’s appreciation, were higher, exceeding 10% for Italy. One key explanation of Italian bonds’ strong performance was that the European Central Bank’s bond purchases were tilted towards buying more of such bonds than in the past.
10-year government bond yields fell to just 0.2% in the UK at the end of September. There has been a substantial increase in the UK government’s new bond issuance. In normal circumstances this would be expected to raise financing costs, but it has been almost completely offset by Bank of England bond purchases.
Equity markets
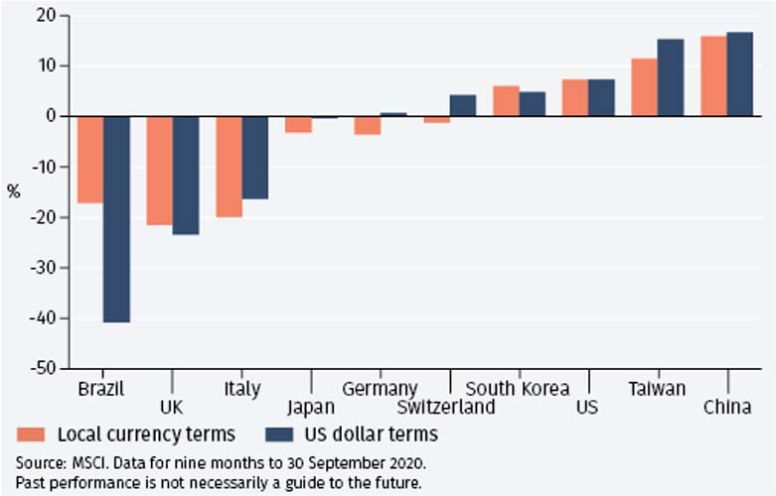
Across global equity markets, the strongest performance in 2020 so far has come from the US market and three Asian markets (China, South Korea and Taiwan). In Asia, that recovery has reflected a recovery in economic growth, led by exports. In the US, the equity market strength has come from the strong performance of the technology and consumer discretionary sectors. Other large sectors – notably energy and banks – have performed poorly. Brazil, one of the hardest-hit economies from Covid-19, has seen its equity market and currency both weaken making it one of the poorest-performing equity markets. The UK equity market has been adversely affected by a perceived poor response to Covid-19, continued uncertainties around Brexit and poor performance of several large bank and energy companies.
UNITED STATES
The near-term focus for the US is the Presidential election on 3 November. Beyond that, three economic issues dominate the outlook: the speed of economic recovery; whether inflation can be pushed higher; and prospects for government debt.
November elections
Forecasting the outcome of US elections is a perilous exercise. In 2016, even polls on the day of the presidential election suggested, wrongly, Hilary Clinton would win. That means models such as that of The Economist,5 which predicts a clean sweep for the Democrats – retaining control of the House of Representatives; taking control of the Senate and with Joe Biden elected president – should be treated with caution. Having said this, the main elements of policy under Democratic control are set to be: higher corporate tax rates; a less aggressive trade policy with China; and an expansion of healthcare provision. However, changes in all three areas involve complexities and are likely to be more marginal than campaign headlines suggest. Trump’s 2018 tax cuts, for example, had bipartisan support; Joe Biden has been a critic of China’s trade policies; and changes in healthcare have been problematic for decades.
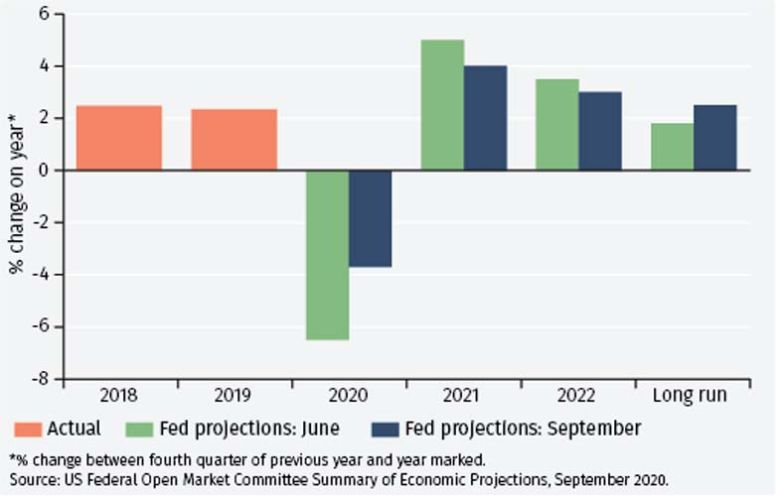
President Trump’s chances of re-election would improve if there were a quick rebound in the economy. That may not be as unlikely as it sounds. The Fed’s latest projections suggest a far better outlook for 2020 growth than was the case just a few months ago (see Figure 10). In every presidential election since 1984, a rise in the US stock market in the three months before the election has seen the incumbent party win; a fall has seen it lose. In that sense, President Trump will hope that the S&P 500 index will be higher than its 3 August level (3295) by election day.
Average inflation
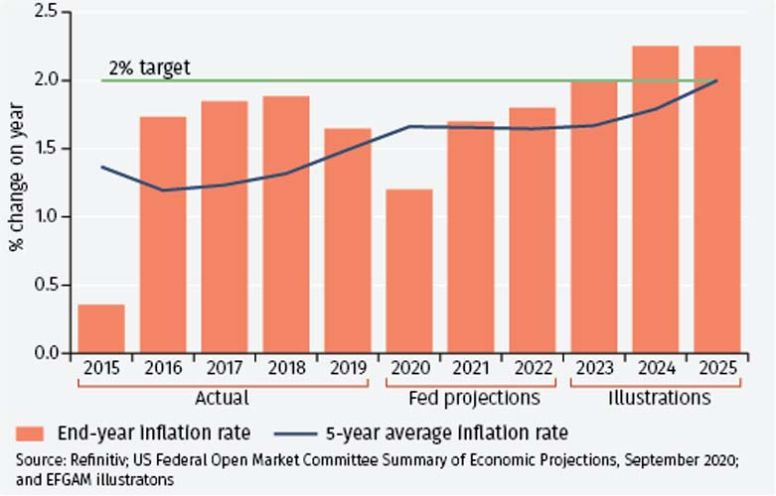
The Fed has announced that it will now seek to achieve average inflation of 2% over a number of years. The precise time period taken into account is not clear but if, for example, it were five years6 then it may well not be until the late 2020s until it is achieved (an illustrative path set out in Figure 11). That suggests US policy interest rates will stay low and monetary policy will remain accommodative for some time.
Bond yields and rising government debt
The other key issue relates to prospects for fiscal policy, US government debt and US Treasury bond yields. 10-year yields, which were almost 2% at the start of 2020, were just 0.68% on 1 October. With US government debt set to rise sharply (see Figure 12), the financing of it is an issue. The optimistic argument is that the US continues to enjoy its ‘exorbitant privilege’ of being able to borrow on attractive terms. But if the Fed is successful in raising inflation to 2% and real interest rates recover as the economy rebounds, current easy financing conditions may prove ephemeral.
UNITED KINGDOM
The UK economic recovery has progressed well. The key issues for the final quarter of the year are whether this progress will be interrupted by a second wave of Covid-19 infections and how the Brexit process unfolds.
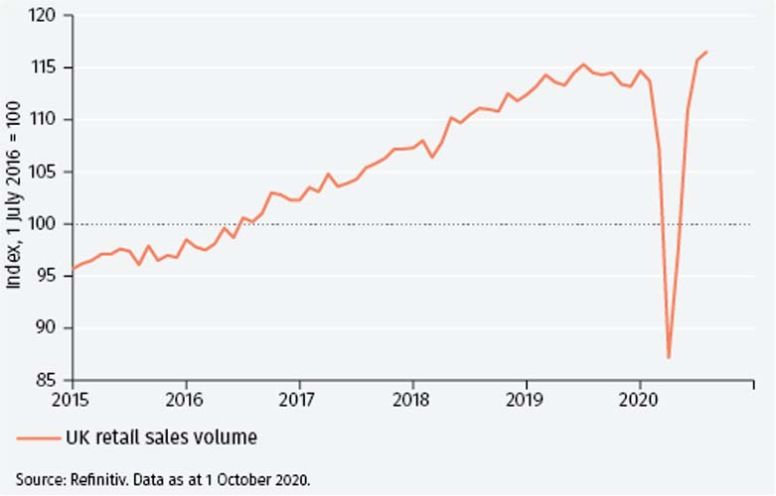
Retail rebound
One indicator that shows the much-discussed V-shaped UK economic recovery is retail sales (see Figure 13). The volume of sales in August was well above the level immediately before the Covid-19 crisis and 2% higher than a year ago.
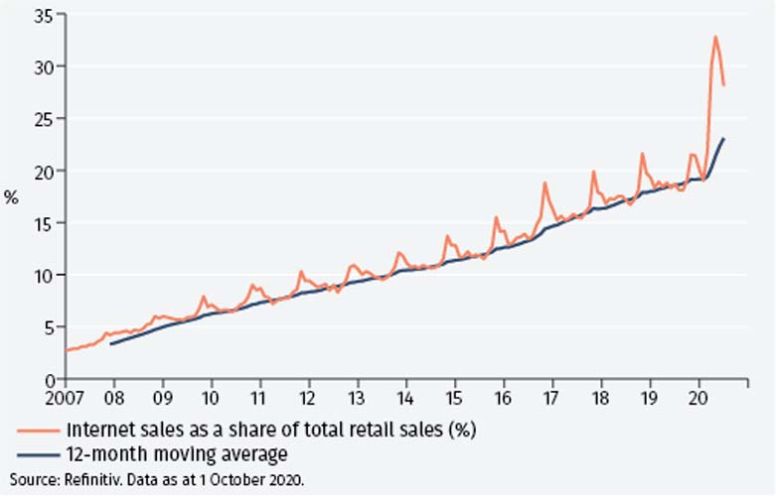
The proportion of sales made online has increased to more than one quarter of the total value (see Figure 14). The latter looks likely to be part of a trend that proves permanent, with clear consequences for high street shopping. Partly, the strength of retail sales reflects a diversion of spending from other areas, such as restaurant meals and overseas travel (that are not included in the measure). UK short-haul airline traffic through Heathrow in August was less than a third of 2019 levels; long-haul travel was just 7% of the previous year’s total.7 Recovery in both types of travel remains slow and may take several years (if ever?) to recover to pre-crisis levels.
These different trends have resulted in the UK’s trade balance improving compared to last year: imports of goods have fallen much more sharply than have exports; and services exports (especially of financial services) have grown as imports have shrunk. An improved trade balance tends to lend support to the value of sterling, which has indeed appreciated against the US dollar from US$1.14/£ at the time of the UK’s lockdown on 23 March to US$1.28/£ on 1 October.
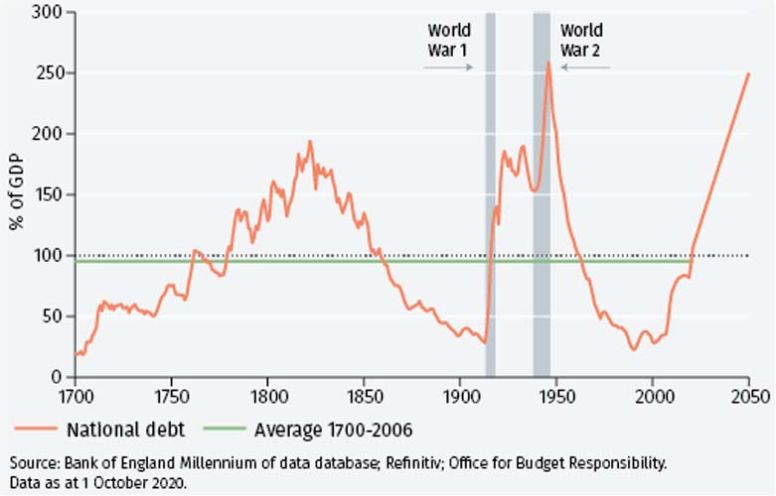
National debt exceeds £2 trillion
The measures in response to Covid-19 have had a significant adverse effect on the government’s finances. Total public sector debt exceeded £2 trillion in July 2020, higher than the level of nominal GDP (see Figure 15). That debt level will certainly rise further in the coming months; and the longer-term trend is even more of a concern. It is expected to be two and a half times the level of GDP by 2050, according to the Office for Budget Responsibility’s latest forecasts. That is mainly due to an ageing population, bringing with it higher social and healthcare payments; and a reduced level of immigration (immigrants generally contribute positively to government finances). The forecast assumes that taxes remain broadly unchanged as a share of the economy, an assumption that clearly may look unrealistic in such circumstances.
Post-Brexit outlook
The likely flexibility of the UK government and the EU’s history of finding last-minute compromises indicates to us that there will be a negotiated resolution to Brexit before the year-end. That does not mean a full agreement will be in place. More likely, the broad outline will be agreed with the details negotiated in the months and years ahead. Short-term disruption may be inevitable; but compared with the shock from Covid-19, maybe this will not be as bad as many fear.
EUROZONE
Despite a second wave of Covid-19 cases, some optimism about prospects for the eurozone economy is evident as we enter the final quarter of the year. In financial markets, yield spreads have, encouragingly, been kept low.
Second wave
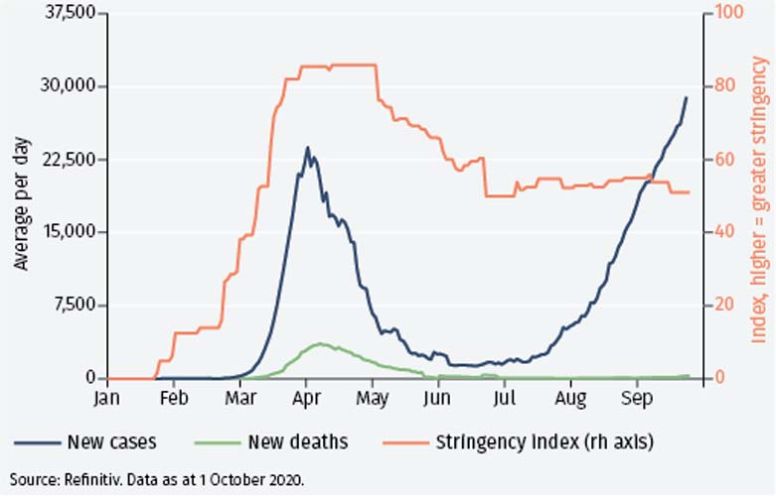
A second wave of Covid-19 cases started across the eurozone during September (see Figure 16) and this is expected to continue in the fourth quarter. In Germany, which was very successful in containing the initial outbreak, Chancellor Merkel has warned of the number of daily cases rising towards 19,000 by the end of the year. France and Spain have seen the most significant rise in cases; Italy less so. Explanations of variations between countries are complex, but at least in Italy’s case it seems to reflect a high acceptance of public health measures (especially the wearing of face masks).
Improving sentiment
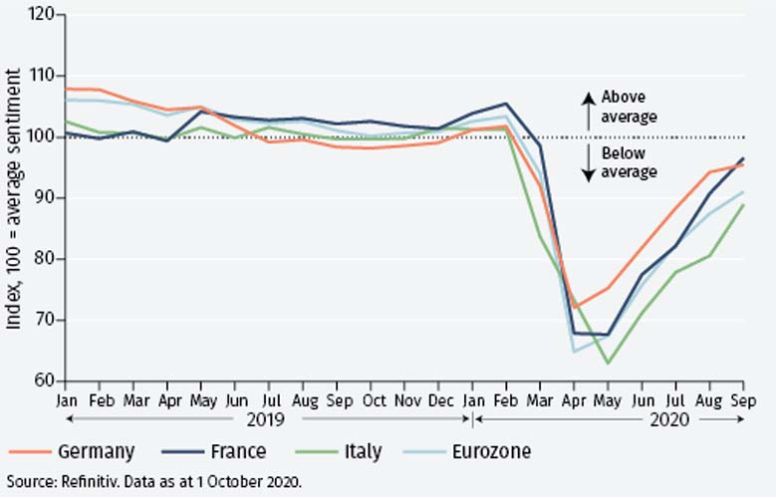
Despite these concerns, there are clear signs that economic sentiment has improved: the European Commission Economic Sentiment Index, for example, has risen sharply in recent months (see Figure 17). The same trend is seen in manufacturing purchasing managers’ indices, which have recovered to the levels of two years ago. The rebound in the services sector is less pronounced and appears to have weakened in recent months (having received an initial boost when lockdown restrictions were first eased).
ECB actions well received
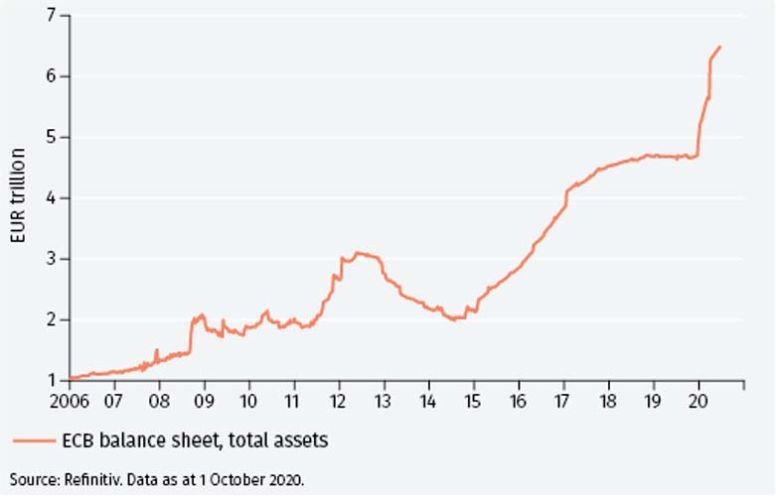
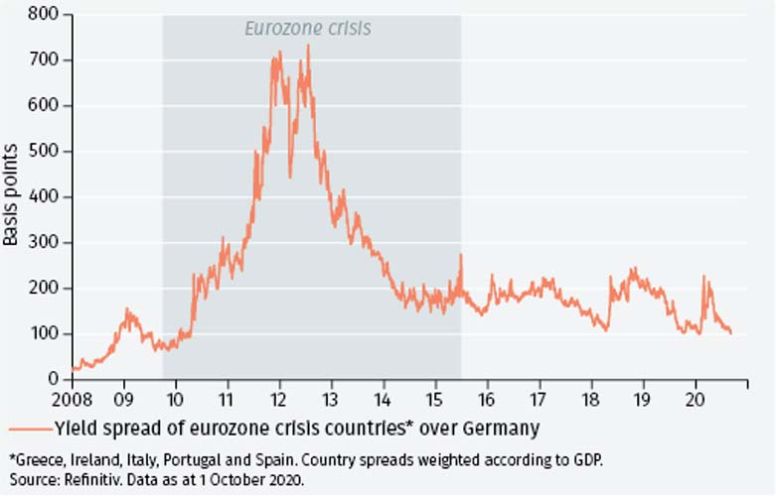
The ECB’s actions during the crisis have generally been well received. It has maintained negative, but tiered policy interest rates, and has expanded its balance sheet significantly (see Figure 18). Perhaps the most significant change in its operations has been to remove the limit on the proportion of a sovereign’s bonds that can be purchased under its asset purchase scheme. This has been key to preventing a widening of yield spreads (see Figure 19). And despite some initial scepticism, EU leaders agreed on a €750 billion European Recovery Fund that will provide grants and loans across the eurozone. Although the disbursement of the funds is expected to be quite slow and the fund is not intended to assume the outstanding debts of member states, it seems to have been effective in increasing confidence in the euro.
SWITZERLAND
Switzerland has been an oasis of relative stability in a turbulent world. But does it need to change? Would a sovereign wealth fund be a good idea?
Switzerland and Covid-19
Switzerland has, in several respects, been somewhat better at dealing with Covid-19 than the rest of Europe. It has had slightly fewer cases per 100,000 population than the eurozone average but only half the number of deaths. As far as the economy is concerned, Swiss GDP is expected to fall by less in 2020 than in most industrialised countries, notably the eurozone.8 Several factors have contributed to this resilience, including specialisation in the export of chemical and pharmaceutical products that have benefited from an ageing population in much of the rest of the world.
Swiss franc
This year, the Swiss franc has been relatively stable against the euro, whilst appreciating against the US$. Our models suggest the Swiss franc’s real effective exchange rate (that is, the exchange rate against a basket of currencies after allowing for relative price levels) is only moderately overvalued. The Swiss National Bank (SNB)’s activism in managing the exchange rate is, in that sense, commendable.
Central banks and SWFs
Periodically, however, concerns are expressed about whether the SNB’s assets are appropriate: are they too big? And would a sovereign wealth fund (SWF) be more appropriate?
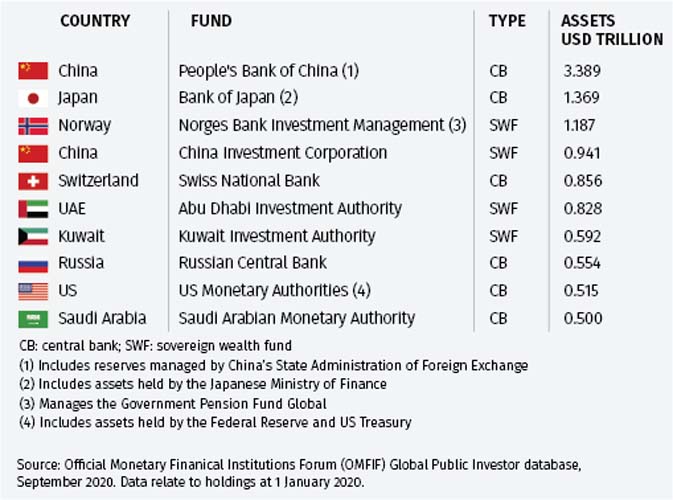
A recent compilation of the size of assets held by central banks and sovereign wealth funds around the world shows the SNB having US$0.856 trillion of assets in mid-2019; the total is now over US$1 trillion. Only two other central banks – of China and Japan – have assets that are larger than the SNB’s.
These assets largely reflect the accumulation of foreign exchange reserves as the SNB has acted to limit the Swiss franc’s appreciation. These capital flows could change direction quickly, leading to a potential rundown of reserves. However, if outflows led to a modest depreciation of the franc, the SNB may well regard this favourably; if the depreciation were to become more marked, the SNB would most likely be happy to raise interest rates, especially given that the policy rate is negative (-0.75%). It seems inconceivable that it would ever need to run down all of the US$1 trillion of foreign exchange reserves to support the Swiss franc.
Transferring the SNB’s assets into a SWF is a proposal that has been made several times in recent years. The mechanics of how that might be done have, themselves, been rightly questioned by the SNB: would the government have to borrow to purchase the SNB’s assets; or maybe the SNB itself would provide the loan.9 The situation is complicated by the fact that the SNB, although it is a joint stock company which is listed on the Swiss equity market, is a hybrid private and public organisation with a complex legal structure.
Furthermore, SWFs have a variety of different purposes. Some have a focus on developing the local economy, say through infrastructure investment. That could be one option for Switzerland, maybe with a focus on environmental investment. However, Swiss pension funds (45 of which rank amongst the largest public investors in the world)10 already have large resources and could fulfil such needs.
Other SWFs have a focus on providing for future generations because a natural resource has finite life: that is the rationale for the Norwegian SWF and many of those in the Gulf region. Such considerations could be relevant for Switzerland.
Many SWFs aim to invest strategically around the world to generate high returns. There are some examples of this working well; but, equally, the poor investment performance of some funds has been criticised. Moreover, the strategic decisions which face any asset manager – the choice between active and passive management, between asset classes (bonds, equities, and alternatives) and how to accommodate sustainability considerations are complex ones. SWFs are typically managed by public sector employees and questions may be raised about how well they can address such issues and the independence of their decisions.
ASIA
Asian export growth has rebounded quickly. Exports are still important for the region’s growth, but increasingly the focus has turned to domestically-orientated sources, especially infrastructure spending.
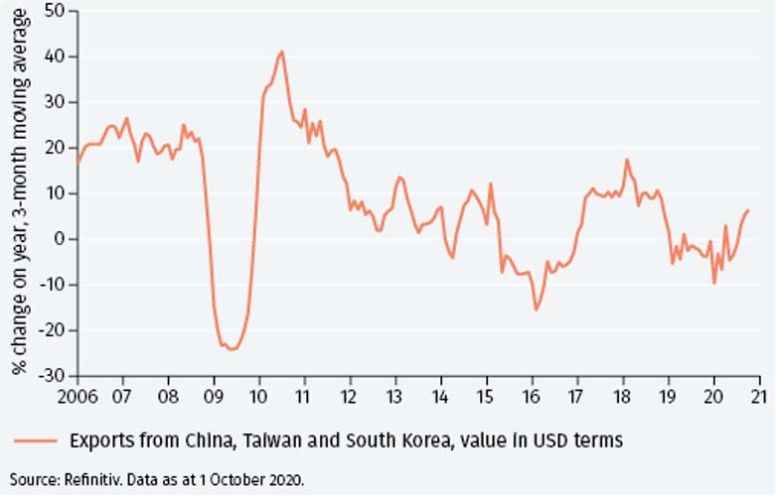
Export rebound
Asian exports have rebounded. In US$ terms they were 5% higher in September 2020 than a year ago (see Figure 21). The explanation lies in the fact that Asia produces much of the medical equipment in demand during the covid-19 crisis; and the equipment needed to facilitate remote working. Helped by the strength of exports but, more fundamentally, reflecting the quick containment of Covid-19, China now looks set to record GDP growth of around 2% in 2020.
Paying for increased investment
China’s Belt and Road Initiative (BRI) is an increasingly important driver of growth across Asia. In 2021, some of the largest recipients of China’s BRI investment are set to record strong growth: 7% or more real GDP growth in the Philippines, Vietnam, Myanmar and Bangladesh, for example (see Figure 22).
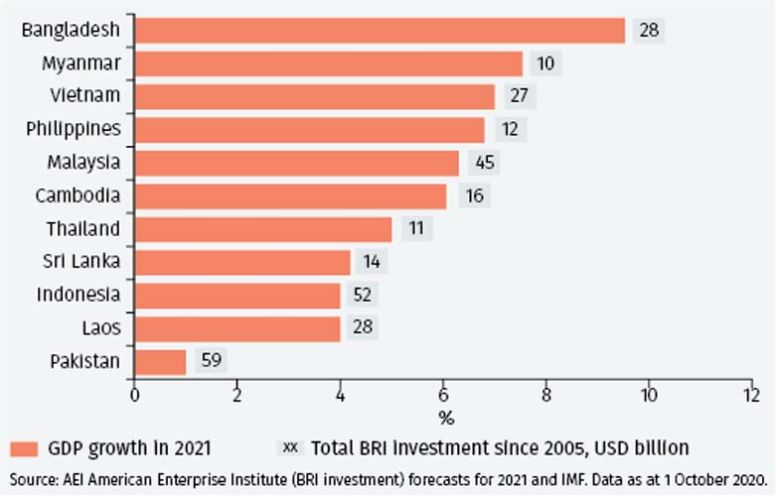
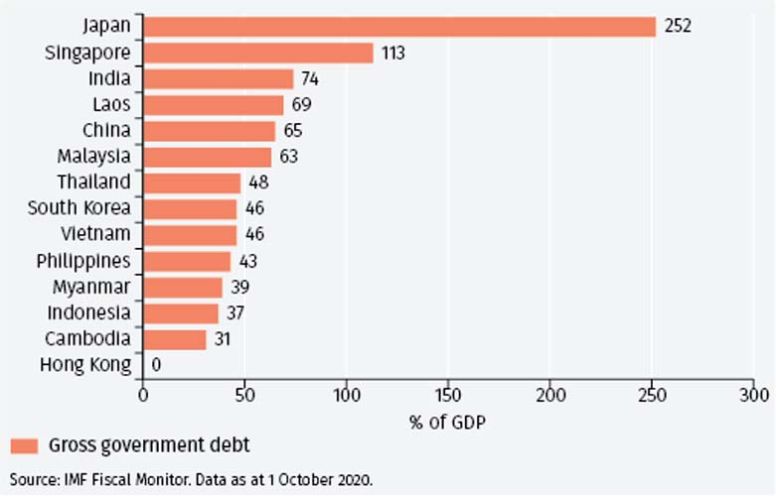
Nevertheless, such investment is no guarantee of success. Pakistan has received US$59bn of BRI investment from China since 2005, largely for the construction of the China-Pakistan Economic Corridor. Yet, the economy of Pakistan remains mired in difficulties, with high inflation and unemployment and a collapse in demand for its exports (which are particularly focused on textiles). It is also limited in its fiscal flexibility, given its high government debt level (see Figure 23); other economies in the region have somewhat more scope in this respect.
India: the next China?
Looking beyond the current difficulties in the region, one important issue is whether other countries, India being the prime candidate, can be the ‘new China’. In India’s favour is its young and growing population. But its system of democratic checks and balances are unlikely to allow, in the words of one recent assessment, “a single-minded China-esque model of growth to materialise”.11 That seems a fair assessment, in our view.
LATIN AMERICA
Across Latin America there have been very different responses and success rates with containing the Covid-19 pandemic. Fiscal policy easing has been limited but interest rates have been cut and further monetary easing is possible.
Covid-19 cases and response
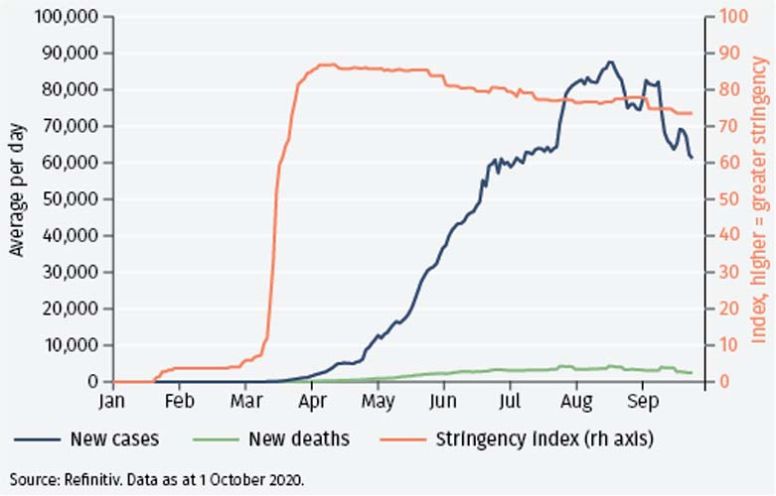
Latin America has been badly hit by Covid-19. The number of cases per one million population exceeds 22,500 (the US rate) in Brazil, Chile, Panama and Peru. The number of new cases is starting to fall (see Figure 25) but, in most economies, stringent restrictions remain. There are some notable exceptions: Uruguay, with less stringent measures than other countries in the region, has a lower incidence of the virus and so far has recorded only 48 deaths.
But for the region a whole, Covid-19 has had a substantial effect with GDP expected to contract by almost 10% in 2020, on the basis of the IMF’s latest forecasts.
Rebuilding economies post-Covid
Rebuilding economies is set to require substantial resources both to meet immediate needs and build a more resilient economy for the future. We see three sources of funds as being important. First, funds from the IMF, which has a range of different programmes. Its new flexible credit lines have already been deployed, providing short-term credit for emergency needs. However, these are restricted to what the IMF describes as countries with ‘platinum quality policies’. Four countries fall into that category: Chile, Colombia, Mexico and Peru. More conventional IMF programmes (such as that for Argentina) have a chequered history in the region and are unlikely to be used enthusiastically.
Second, the IADB (Inter-American Development Bank) may well play a greater role under its new leader, Mauricio J. Claver-Carone, a Cuban-American. The first president of the institution from outside the region, he is expected to forge closer ties with the US. This, to us, seems consistent with our long-held view that the world will become tripolar. Latin America is well-placed to make greater inroads into the north American supply chain, potentially emulating the success of Mexico in that respect.
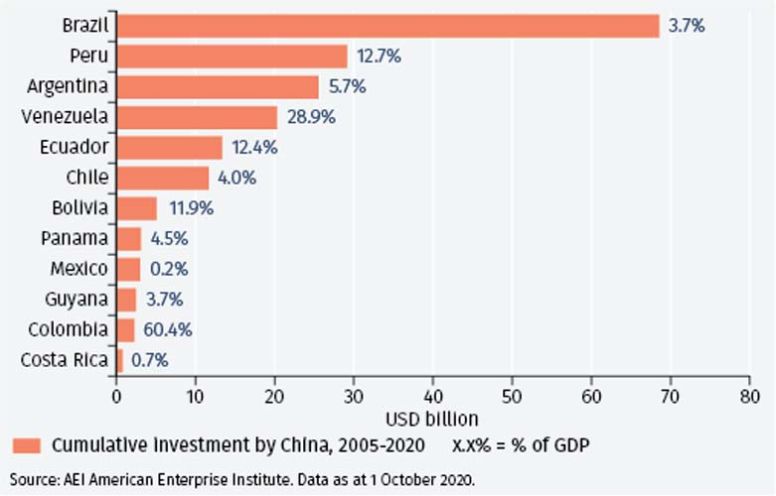
Increased interest in pan-American development may well have a close eye on China’s increasing involvement in the region, the third source of investment funds.
In the region, Brazil has received the most investment from China, amounting to almost US$70 bn since 2005 (see Figure 26). That investment has been largely in the agricultural sector. Other economies receiving Chinese funds – Argentina and Venezuela – are less likely to be favoured by investors with a more capitalist orientation.
Proposals for an extension of Argentina’s wealth tax to citizens living outside the country are unlikely to kindle the interest of western investors seeking investment opportunities.
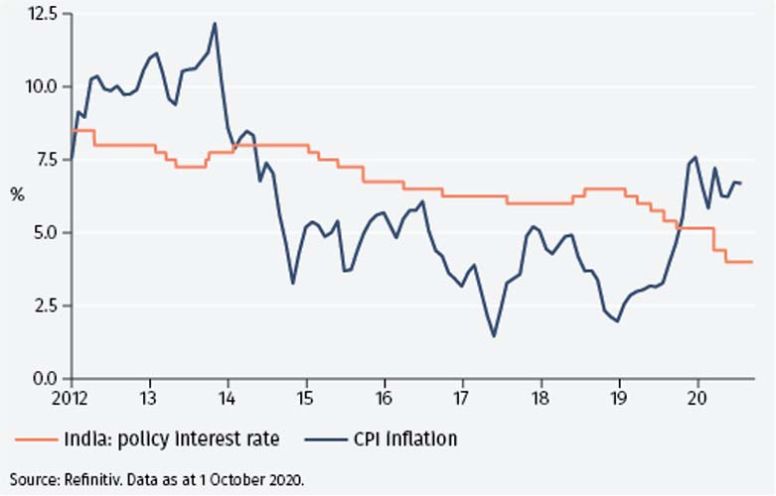
Monetary easing
On a more optimistic note, there is scope for more monetary easing, especially in economies, such as Brazil, where inflation has fallen sharply. Even so, in both Brazil and Mexico, the effects of currency weakness risk pushing inflation higher in the short term. Two countries with already low official interest rates – Peru and Chile – are in a position to be able to use quantitative easing if needed.
Latin America will undoubtedly weather this latest storm; but brighter prospects may not be evident until into 2021.
SPECIAL FOCUS – COVID-19 AND UNIVERSITIES
Around the world, Covid-19 has brought into question the way education is delivered. In the university sector, access to the best resources may improve. Weaker universities will be under pressure.
Covid-19 has the potential to trigger an important change in the delivery of education. With many students around the world self-isolating in university accommodation and lectures delivered online, a fundamental change in the way in which university education is delivered may be in prospect. We explore some of the issues.
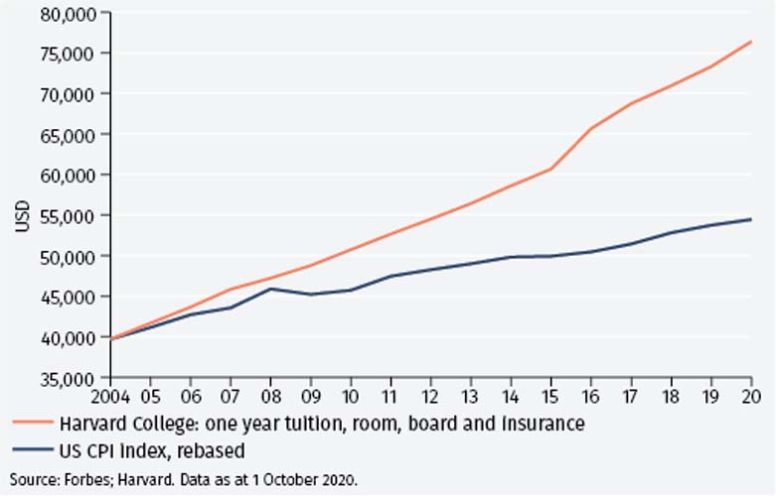
The cost
A good university education is expensive. For the 2020-2021 academic year, the cost of attending Harvard is around US$75,000 per year (for tuition, room, board and insurance). That cost has risen much more than the rate of US consumer prices since 2004 (see Figure 27). The cost increase has been largely unaffected by the events that have troubled the rest of world: in the global financial crisis (between 2007 and 2010) the annual cost of attending Harvard rose by 10%, for example.
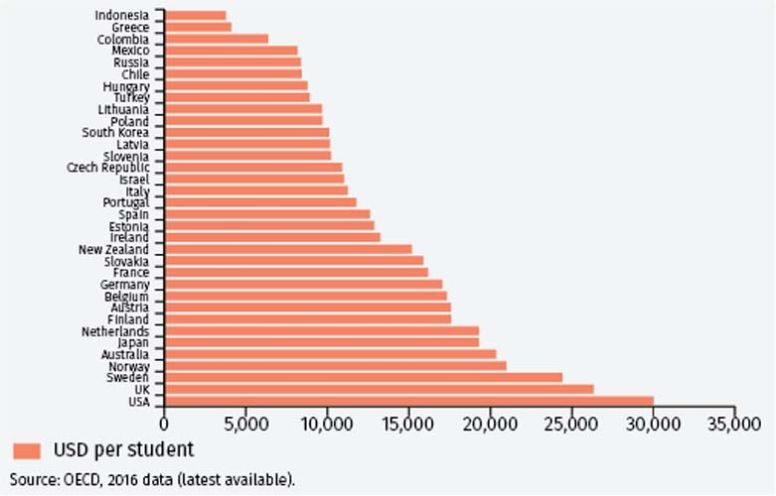
Harvard is expensive, of course, but across the US tertiary education sector OECD data show an average cost of US$30,000 per year (see Figure 28). The UK is not far behind, but costs in many developing countries are much lower.
Distance learning and MOOCs
The important issue this raises is whether access to the teaching available at the best institutions can become more easily accessible. For some time, distance learning and, more recently, MOOCs (mass open online courses) have been offered by many universities. They have been somewhat successful, but many are sceptical about whether they can replace the traditional offering.
The arguments that these cannot fully replace the in-person, physical experience of attending university are that: there are many benefits from such an experience that go far beyond formal lectures and teaching; tutorials and small seminars are, arguably, hard to replicate outside the physical university and informal meetings and the network formed by attending university are very hard to replicate without physical contact.
Set against these considerations, however, is the fact that the quality of teaching varies between different universities. A lecture by a Nobel prizewinning economist at one is likely to cast a long shadow over one delivered by a PhD student at another. And the same distinction applies when the delivery is online: a poorly produced talking head video is unlikely to make its point as well as a well-produced interactive presentation.
Winner takes all
In that sense, university education may well become characterised by ‘winner takes all’: the best institutions may flourish and prosper; weaker ones may not survive. Reaching a wider market for the material produced by the best universities may enable them to generate higher revenue, facilitating the ability to reinvest in an even better product. A virtuous circle may develop. At the other extreme, weaker universities may find it harder to attract fee paying students. This is especially the case as there is a lack of price discrimination in many countries, such as the UK where many universities charge the maximum allowable tuition fee of £9,250 p.a.
A move to greater use of online resources brings its own challenges. The Covid-19 experience has shown the importance of having access to the broadband, wifi and equipment to make remote working and learning possible. That may be a particular problem in emerging economies, where such infrastructure may be lacking.
In tertiary education, as more generally, Covid-19 has highlighted that access to new technology is the key to functioning effectively in the new world.
Footnotes
1 Thomas Orlik, The Bubble that Never Pops, Oxford University Press, 2020.
2 Approximately, the debt level will be stabilised if the government budget deficit (excluding interest payments) is smaller than the gap between the interest rate paid on debt and the nominal growth rate, multiplied by the debt/GDP ratio.
3 McKinsey. https://www.mckinsey.com/about-us/new-at-mckinsey-blog/a-revolutionary-tool-for-cutting-emissions-ten-years-on
4 The Bloomberg Barclays Global Aggregate Bond Index is a benchmark of government and investment grade corporate debt from developed and emerging markets issuers in 24 countries.
5 https://projects.economist.com/us-2020-forecast/president
6 The Fed has made clear there is no numerical formula. See, for example, the comments made by Charles Evans, President of the Federal Reserve Bank of Chicago, on 22 September 2020 in an OMFIF virtual seminar.
7 Source: Gridpoint Consulting; 1 October 2020.
8 See ‘Swiss economic resilience and export specialisation’, EFG Infocus, October 2020.
9 See Thomas Jordan’s 29 April 2016 speech: https://www.snb.ch/en/mmr/speeches/id/ref_20160429_tjn/source/ref_20160429_tjn.en.pdf
10 Official Monetary Financial Institutions Forum (OMFIF) Global Public Investor database, September 2020.
11 The Great Demographic Reversal, Charles Goodhart and Manoj Pradhan, Palgrave Macmillan, 2020.
Important Information
The value of investments and the income derived from them can fall as well as rise, and past performance is no indicator of future performance. Investment products may be subject to investment risks involving, but not limited to, possible loss of all or part of the principal invested.
This document does not constitute and shall not be construed as a prospectus, advertisement, public offering or placement of, nor a recommendation to buy, sell, hold or solicit, any investment, security, other financial instrument or other product or service. It is not intended to be a final representation of the terms and conditions of any investment, security, other financial instrument or other product or service. This document is for general information only and is not intended as investment advice or any other specific recommendation as to any particular course of action or inaction. The information in this document does not take into account the specific investment objectives, financial situation or particular needs of the recipient. You should seek your own professional advice suitable to your particular circumstances prior to making any investment or if you are in doubt as to the information in this document.
Although information in this document has been obtained from sources believed to be reliable, no member of the EFG group represents or warrants its accuracy, and such information may be incomplete or condensed. Any opinions in this document are subject to change without notice. This document may contain personal opinions which do not necessarily reflect the position of any member of the EFG group. To the fullest extent permissible by law, no member of the EFG group shall be responsible for the consequences of any errors or omissions herein, or reliance upon any opinion or statement contained herein, and each member of the EFG group expressly disclaims any liability, including (without limitation) liability for incidental or consequential damages, arising from the same or resulting from any action or inaction on the part of the recipient in reliance on this document.
The availability of this document in any jurisdiction or country may be contrary to local law or regulation and persons who come into possession of this document should inform themselves of and observe any restrictions. This document may not be reproduced, disclosed or distributed (in whole or in part) to any other person without prior written permission from an authorised member of the EFG group.
This document has been produced by EFG Asset Management (UK) Limited for use by the EFG group and the worldwide subsidiaries and affiliates within the EFG group. EFG Asset Management (UK) Limited is authorised and regulated by the UK Financial Conduct Authority, registered no. 7389746. Registered address: EFG Asset Management (UK) Limited, Leconfield House, Curzon Street, London W1J 5JB, United Kingdom, telephone +44 (0)20 7491 9111.
Please use the button below to download the full article.