- Date:
Insight - Although Covid concerns will feature in the first part of the year, we are generally optimistic about the outlook for global economic growth in 2022. With inflation rates set to fall back, the economic backdrop remains generally benign.
OVERVIEW
World growth in 2023 is set to be a little lower than the pre-pandemic rate but, more importantly, the pattern is changing. Where interest rates settle after the tightening process comes to an end remains key for financial markets.
Podcast Ep 81: The Shifting Sands of the Global Economy
Shifting sands of global growth
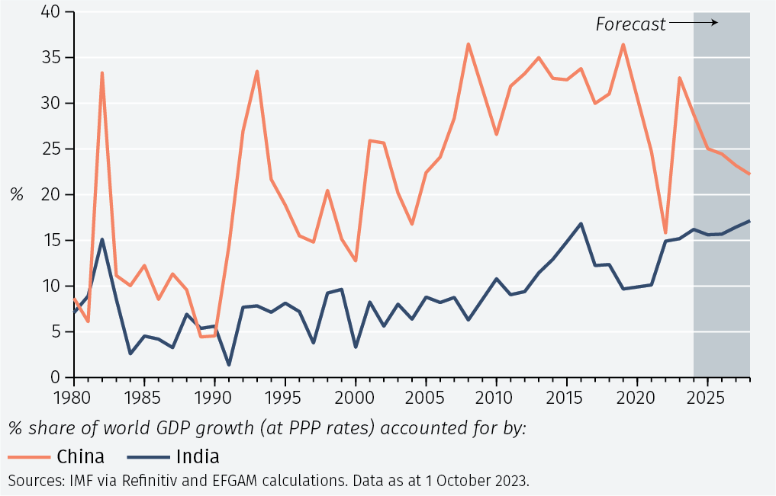
Overall world growth in 2023 seems likely to be a little lower than the rate seen in the years immediately pre-Covid (see Figure 1). But the composition of that growth is changing. The US economy has proved surprisingly strong, with growth running at an annualised rate of around 5% in the third quarter, according to one estimate. In contrast, the German economy remains in (admittedly, a mild) recession. China’s growth has been disappointing, especially for those expecting a big surge following the end of the zero-Covid policy. But elsewhere in emerging economies, Brazil’s strength has surprised and India is set to be the fastest growing major economy, not just this year, but for the next five years. Its contribution to world growth is set to increase steadily (see Figure 2), albeit still below the contribution of China.

These shifting sands of global growth are nothing new. Country, regional and industry-specific patterns of growth vary over time. From the end of World War 2 to the mid-1960s, Italy enjoyed a prolonged economic boom; now it has a stagnant economy and demographic trends which will perpetuate that trend. In the 1970s, Gulf economies boomed as the west suffered from two oil price shocks. In the 1980s, no one seriously thought of the US as a major global car producer and exporter. Now, it is a leader in electric vehicles (EVs). European car makers are finding life difficult, especially as they face the threat of cheap Chinese imports. In the Covid pandemic, there was a worldwide shift from consumer spending on services (travel and entertainment, in particular) to goods (such as working-from home technology), a trend which has now reversed.
US technology lead
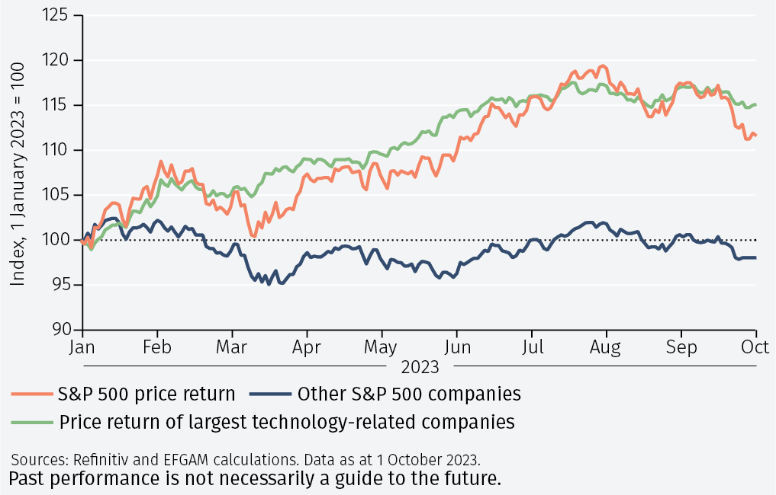
The perceived lead of US companies not just in EVs but in technology, especially AI artificial intelligence), has propelled the strong equity price performance of the largest technology-related companies (see Figure 3). This technological lead combined with strong balance sheets and cash flows mean that they are increasingly seen as defensive, taking on the role conventionally attributed to consumer staples and utilities. Not all technology companies are in such a strong position, of course. For some, profitability may be some way in the future: they are ‘long duration’ assets and so are sensitive to higher interest rates.
Stars and TIPs
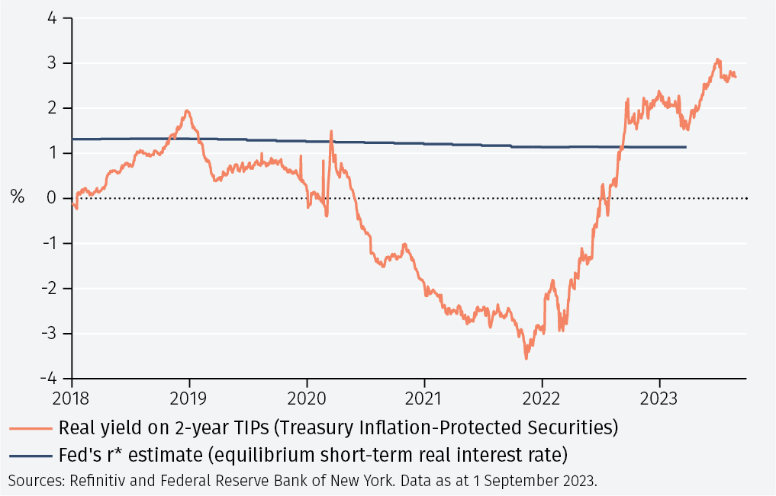
That raises the issue of how close we are to peak policy interest rates and at what level they may stabilise. One answer is provided by the Fed, which has resumed publication of its estimate of r* (r star) – the equilibrium real short-term interest rate which produces on-target inflation and growth at its potential rate. It has been stable for some time: the near-horizontal line at just over 1% shown in Figure 4. If that is correct and the Fed is successful in returning inflation to 2% (or, as we consider more realistic, sufficiently close to that – say, 2.5%), it suggests a neutral nominal rate of around 3.5%. But this stability of r* is in sharp contrast to the volatility of other real rate measures. The real yield on 2-year Treasury Inflation-Protected Securities has swung from minus 3% to plus 3% over the last two years. The contrast between the steady Fed estimate and the wild ride of market rates raises the question of which measure provides the best guide to equilibrium long-term rates.
When the Fed started to raise interest rates, many were concerned about the implications for economic growth - it could trigger recession – and the equity market – which could suffer due to weaker corporate earnings and already high valuations. Neither has happened. Over the last 12 months there have been no days when the S&P 500 index has fallen by more than two standard deviations – such losses were much more common in the past (see Figure 5). But low equity market volatility has been a temporary phenomenon in the past.
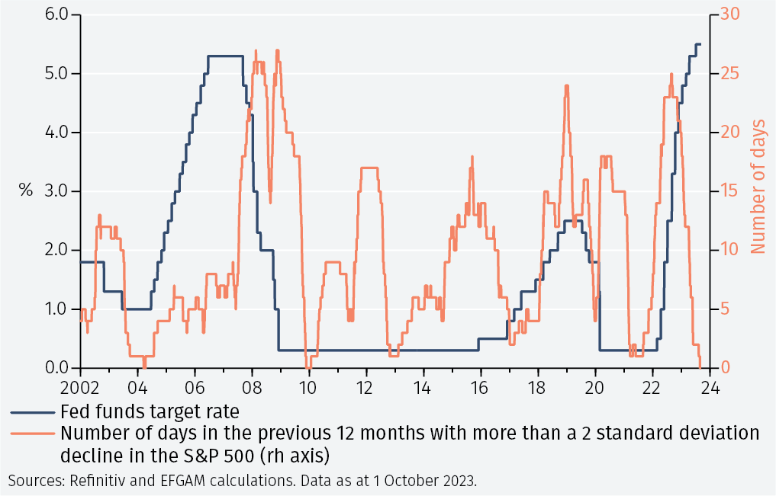
With interest rates having been raised to pre-2008 levels and, perhaps more importantly, the Fed reducing its balance sheet, a rise in US equity market volatility is feasible.
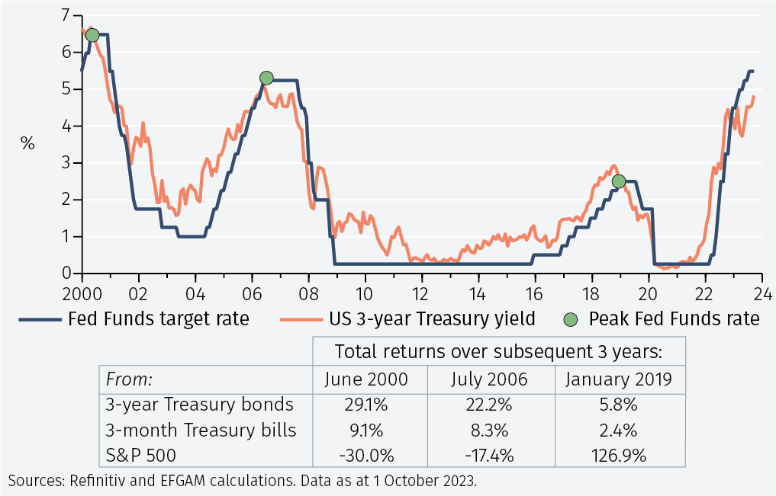
After the Fed’s three previous tightening episodes – interest rates fall back quite quickly. What is clear from those three previous episodes is that 3-year Treasury bonds provided a higher return than shorter maturity, money market investments (see the table below Figure 6). Reinvestment risk can be very high once the interest rate cycle turns. The historic pattern of equity returns in those three periods is mixed: weakness after the interest rate reversals following the June 2000 and July 2006 peaks, but strength after the peak in January 2019.
Delayed reaction
Of course, it could well be that the reaction of the US economy to higher rates is simply delayed and that weaker US growth is now in prospect. For some time, we have seen the inverted yield curve as signalling a recession potentially starting around the end of the year. Higher longer-term bond yields feed directly to higher mortgage rates and a weaker housing market; and a weaker housing market has been an important determinant of the US business cycle in the past.
Furthermore, it may be too early to claim victory over high inflation, in which case policy rates may not yet have peaked. And, in a world buffeted by repeated shocks, it is unwise to claim any certainty about what is over the horizon, especially when half the world’s population votes for new leaders in 2024.
To continue reading, please download the full article.
Important Information
The value of investments and the income derived from them can fall as well as rise, and past performance is no indicator of future performance. Investment products may be subject to investment risks involving, but not limited to, possible loss of all or part of the principal invested.
This document does not constitute and shall not be construed as a prospectus, advertisement, public offering or placement of, nor a recommendation to buy, sell, hold or solicit, any investment, security, other financial instrument or other product or service. It is not intended to be a final representation of the terms and conditions of any investment, security, other financial instrument or other product or service. This document is for general information only and is not intended as investment advice or any other specific recommendation as to any particular course of action or inaction. The information in this document does not take into account the specific investment objectives, financial situation or particular needs of the recipient. You should seek your own professional advice suitable to your particular circumstances prior to making any investment or if you are in doubt as to the information in this document.
Although information in this document has been obtained from sources believed to be reliable, no member of the EFG group represents or warrants its accuracy, and such information may be incomplete or condensed. Any opinions in this document are subject to change without notice. This document may contain personal opinions which do not necessarily reflect the position of any member of the EFG group. To the fullest extent permissible by law, no member of the EFG group shall be responsible for the consequences of any errors or omissions herein, or reliance upon any opinion or statement contained herein, and each member of the EFG group expressly disclaims any liability, including (without limitation) liability for incidental or consequential damages, arising from the same or resulting from any action or inaction on the part of the recipient in reliance on this document.
The availability of this document in any jurisdiction or country may be contrary to local law or regulation and persons who come into possession of this document should inform themselves of and observe any restrictions. This document may not be reproduced, disclosed or distributed (in whole or in part) to any other person without prior written permission from an authorised member of the EFG group.
This document has been produced by EFG Asset Management (UK) Limited for use by the EFG group and the worldwide subsidiaries and affiliates within the EFG group. EFG Asset Management (UK) Limited is authorised and regulated by the UK Financial Conduct Authority, registered no. 7389746. Registered address: EFG Asset Management (UK) Limited, Park House, 116 Park Street, London W1K 6AP, United Kingdom, telephone +44 (0)20 7491 9111.