- Date:
- Author:
- Sam Jochim
Infocus - Inflation has surged to levels not seen in decades due to rising commodity prices, supply chain bottlenecks and tight labour markets. These factors apply to most developed countries, but not to Switzerland where inflation remains low. In this edition of Infocus, GianLuigi Mandruzzato compares Swiss inflation to that in the US and the eurozone and draws some policy implications.
Contrasting data can create a confusing picture about the economic environment. One reason is that some data leads the business cycle while other data lags. In this edition of Infocus, Economist Sam Jochim analyses what leading and lagging indicators are telling us about the current state of the US, eurozone and UK economies.
The Conference Board, an independent US think tank, produces leading indicators for many economies. These include data which are thought to lead – that is, move in advance of – the business cycle. For example, average weekly hours for the manufacturing sector are included as a leading indicator because employers tend to reduce work hours before they make staff redundant.
US Conference Board Indicators
The Conference Board also produces coincident indicators for many economies. These aim to provide an indication of the current state of the business cycle and include data such as net hiring and industrial production.
For the US, the Conference Board also produces a lagging indicator. It includes items that lag – or follow – the business cycle. For example, a series measuring the level of outstanding commercial and industrial loans is included because it tends to peak after the business cycle as falling profits encourage an increase in the demand for loans (sometimes referred to as ‘distress lending’).
Historically, the 6-month annualised change in the leading indicator has been a useful tool for identifying turning points in the business cycle. In October 2007, this measure of the leading indicator passed its recession warning threshold (see Figure 1).
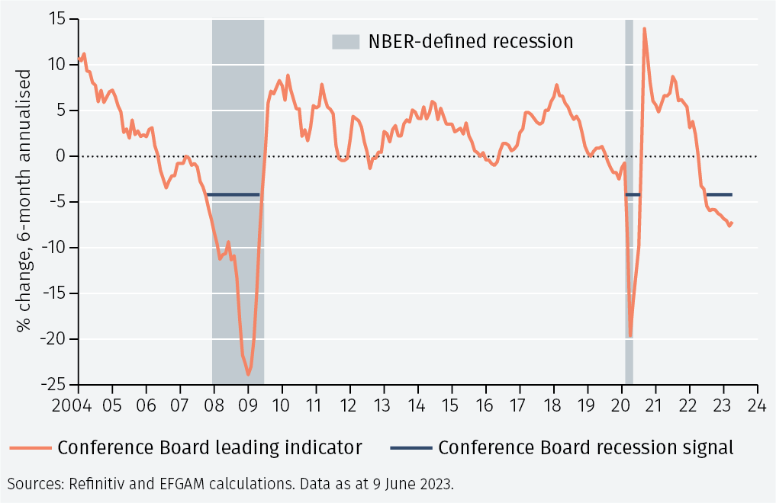
The US entered recession, according to the National Bureau of Economic Research (NBER), two months later in December 2007. It is notable that this measure is currently signalling a recession in the US.
While the 6-month annualised change in the leading indicator is used by the Conference Board as a recession signal, we use year-on-year changes to assess the general strength of leading and lagging data (as shown in Figure 2, below). At the onset of the recession in 2007, the leading indicator was negative in year-on-year terms. Contrasting this, the coincident and lagging indicators were both still positive. The coincident indicator only turned negative in year-on-year terms five months into the recession and the lagging indicator only did so in the first month following the end of the recession.
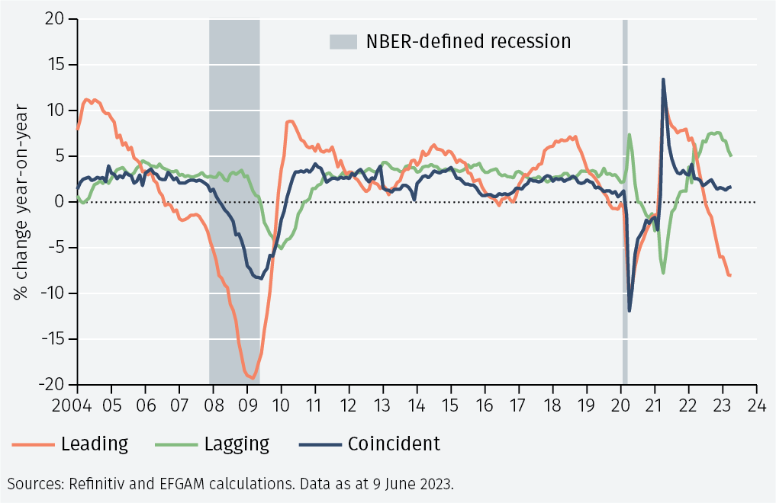
In 2020, the Covid pandemic caused a recession. Despite the sudden-stop nature of that recession, it is notable that the leading indicator declined before the coincident and lagging indicators although it was less useful as a predictor of recession than it had been in previous downturns.
The contrasting signals sometimes given by leading and lagging indicators highlight an issue which is particularly important in the current economic climate. While it is plausible that the US economy avoids a recession, the argument should not be based purely on lagging data as it is possible that this data remains strong while the economy is already in recession. Furthermore, even data which are defined by the Conference Board as coincident can remain positive while the economy is in recession.
US Conference Board Indicators and employment data
Looking at the ‘Employment Situation Summary’ for May from the Bureau of Labor Statistics highlights some interesting points. The data appeared contradictory. The increase in nonfarm payroll employment was strong at 339,000. The average duration of unemployment also suggested strength in the labour market: it declined from 22.4 weeks to 21.9 weeks and continued the downward trend since January 2022. However, these signs of labour market strength were accompanied by signs of weakness. For example, there was a fall in average weekly hours worked from 34.4 to 34.3, continuing the downward trend since March 2022.
An explanation for these conflicting messages is that some data is leading while other data is lagging. According to the Conference Board, the change in non-farm payroll employment is coincident with the business cycle and reflects actual net hiring and firing. Changes in average weekly hours worked lead the business cycle as firms tend to cut hours before they cut staff in economic downturns. Unemployment duration lags the business cycle as the sharpest increases in unemployment tend to occur after recessions have begun.
Investigating the relationships of these variables with real GDP in the US confirms the Conference Board’s assertations (see Figure 3). Average duration of unemployment is inverted so that an increase in unemployment duration is reflected as a decline in the data. Quarterly averages are constructed, and correlations are computed with real GDP with leads and lags up to eight quarters.
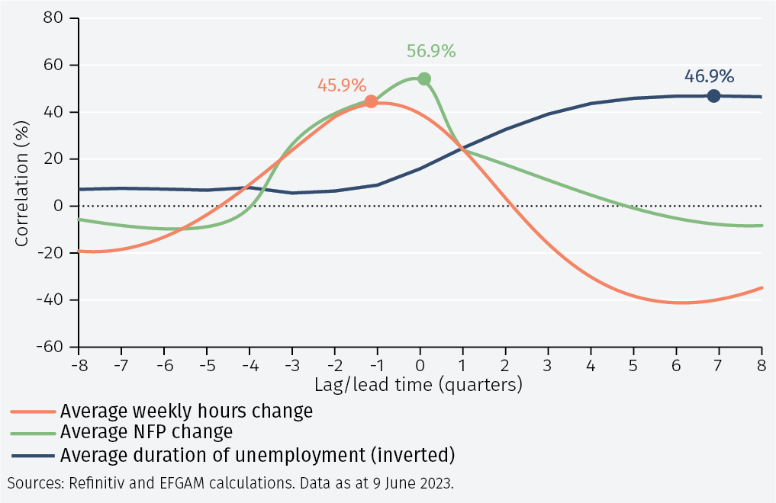
The correlation between average weekly hours and real GDP peaks one quarter ahead of real GDP growth, implying that changes in average weekly hours lead changes in GDP by around one quarter. The correlation between the change in non-farm payroll employment and real GDP growth peaks without any lead or lag. The correlation with average duration of unemployment implies a lag of around seven quarters.
When framed in this context, strength in the latest US labour market report appears in the lagging and coincident data, while weakness appears in the leading data. More broadly, the Conference Board coincident and lagging indicators currently remain positive in the US in year-on-year terms. Looking only at this data, the US economy does not currently appear weak. However, the leading indicator is negative in year-on-year terms, implying that weakness may lie ahead. Looking at the 6-month annualised change, as the Conference Board does to signal recession warnings, it appears that the risk of recession in the US has risen materially.
Click here to continue reading
Important Information
The value of investments and the income derived from them can fall as well as rise, and past performance is no indicator of future performance. Investment products may be subject to investment risks involving, but not limited to, possible loss of all or part of the principal invested.
This document does not constitute and shall not be construed as a prospectus, advertisement, public offering or placement of, nor a recommendation to buy, sell, hold or solicit, any investment, security, other financial instrument or other product or service. It is not intended to be a final representation of the terms and conditions of any investment, security, other financial instrument or other product or service. This document is for general information only and is not intended as investment advice or any other specific recommendation as to any particular course of action or inaction. The information in this document does not take into account the specific investment objectives, financial situation or particular needs of the recipient. You should seek your own professional advice suitable to your particular circumstances prior to making any investment or if you are in doubt as to the information in this document.
Although information in this document has been obtained from sources believed to be reliable, no member of the EFG group represents or warrants its accuracy, and such information may be incomplete or condensed. Any opinions in this document are subject to change without notice. This document may contain personal opinions which do not necessarily reflect the position of any member of the EFG group. To the fullest extent permissible by law, no member of the EFG group shall be responsible for the consequences of any errors or omissions herein, or reliance upon any opinion or statement contained herein, and each member of the EFG group expressly disclaims any liability, including (without limitation) liability for incidental or consequential damages, arising from the same or resulting from any action or inaction on the part of the recipient in reliance on this document.
The availability of this document in any jurisdiction or country may be contrary to local law or regulation and persons who come into possession of this document should inform themselves of and observe any restrictions. This document may not be reproduced, disclosed or distributed (in whole or in part) to any other person without prior written permission from an authorised member of the EFG group.
This document has been produced by EFG Asset Management (UK) Limited for use by the EFG group and the worldwide subsidiaries and affiliates within the EFG group. EFG Asset Management (UK) Limited is authorised and regulated by the UK Financial Conduct Authority, registered no. 7389746. Registered address: EFG Asset Management (UK) Limited, Park House, 116 Park Street, London W1K 6AP, United Kingdom, telephone +44 (0)20 7491 9111.