- Date:
Infocus - Bond Market Blues
The behaviour of long bond yields and breakeven inflation calculated from Treasury inflation-protected securities (TIPS) yields suggests that market participants are worried about the outlook for inflation. In this issue of Infocus, EFG chief economist Stefan Gerlach shows that breakeven inflation tends to be depressed in periods of financial market stress, and therefore spuriously appears to rise when such episodes end. While expected inflation has increased since the spring of 2020, it has done so far less than breakeven inflation suggests.
Market participants are worried about the outlook for inflation. The main driver of these concerns appears to be the massive fiscal stimulus programme launched by the Biden administration, which is expected to lead to a sharp boost to activity. Between December 2020 and March 2021, the OECD revised up its forecast for US real GDP growth from 3.3% to 6.5% in 2021 and from 0.5% to 4.0% in 2022.1 Similarly, the median FOMC member’s projection for real GDP growth for 2021 rose from 4.2% in December to 6.5% in March, and the median projection for PCE inflation in 2021 rose from 1.8% to 2.4%.2
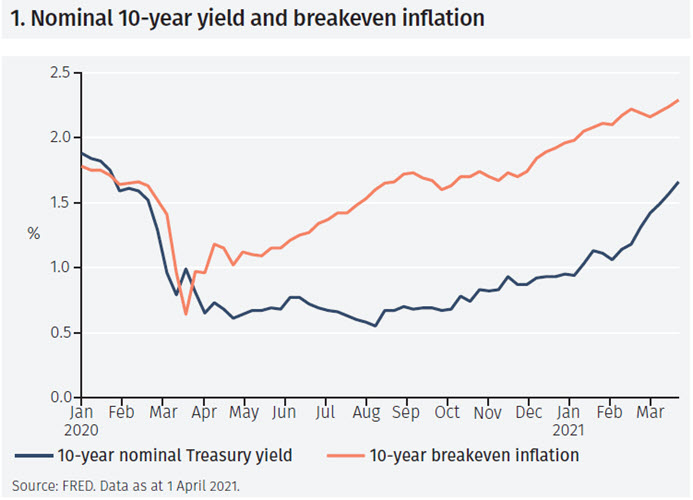
As a result, market-based measures of inflation expectations have risen sharply.3 Thus, 10-year breakeven inflation, measured as the spread between 10-year nominal and indexed Treasury yields, rose by 1.65% between 20 March 2020 and 19 March 2021.4 Nominal 10-year yields also rose abruptly by 1.05% between 24 April 2020 and 19 March 2021.
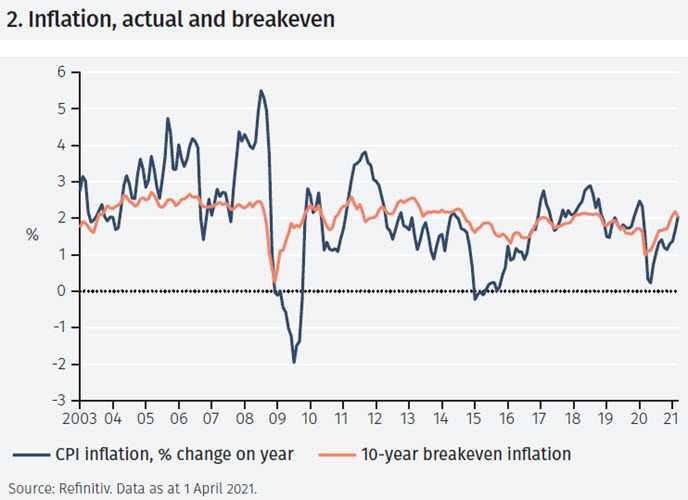
But how much weight should be attached to breakeven inflation as a measure of expected inflation? Does it provide clean signals of changes in inflation expectations or is the information it contains hidden by other factors? To address these questions, Figure 2 shows monthly data on headline CPI inflation (which inflation-protected bonds are indexed to), and breakeven inflation calculated as the difference between 10-year nominal bonds and TIPS. Both series show large declines around the time of the Global Financial Crisis in 2008-9 and during Covid in 2020, which is compatible with the idea that deep downturns lead to a fall in inflation. Interestingly, the average annual inflation rate during the 18-year period shown in the graph is 2.05%, almost exactly identical to average breakeven inflation, which is 2.03%. This is striking since inflation measures price changes over the past 12 months, while breakeven inflation pertains to the next 10 years (which is why it is much more stable).
The idea that the spread between yields on nominal and inflation-indexed bonds measures expected inflation assumes that differences between them are due solely to inflation. In practice, that is not the case: the market for indexed bonds is smaller and much less liquid. Indeed, indexed bonds are primarily held, often to maturity, by investors with long-term obligations that are tied to the rate of inflation.
This suggests that nominal bonds are more attractive in episodes of financial tension when market participants put a premium on liquidity. Thus, when markets come under stress, the yields on indexed bonds rise to compensate for their relative illiquidity. Breakeven inflation therefore spuriously appears to fall when financial market tensions rise, and spuriously seems to rise when they abate. Might this effect be so large as to impair the information content of breakeven inflation?
To explore this question, Figure 3 below shows the VIX (inverted scale) together with 10-year breakeven inflation. It suggests that between 2003 and 2012, variations in the VIX explain a large fraction of the variation in expected inflation. From 2013 onward, however, breakeven inflation was plainly lower than what one would have expected given the VIX.
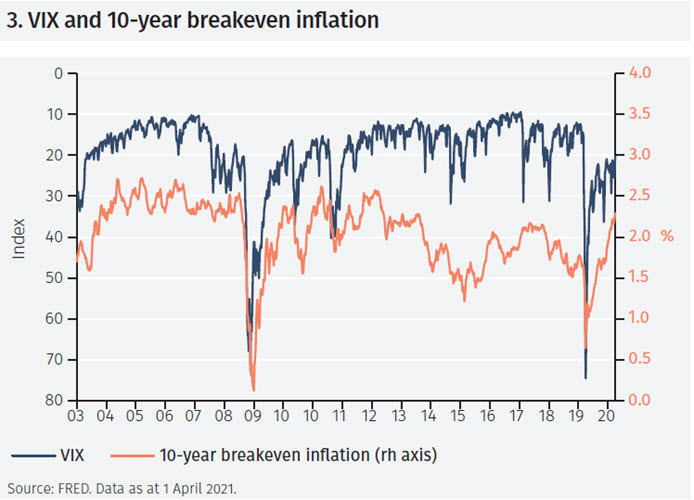
Importantly, the surge in the VIX in the spring of 2020 as the covid pandemic struck seems associated with a collapse of breakeven inflation. And as the VIX declined, breakeven inflation rose as financial market tensions subsided. The figure thus suggests that part of the recent increase in breakeven inflation reflects a normalisation in financial markets since last spring rather than an increase in expected inflation.
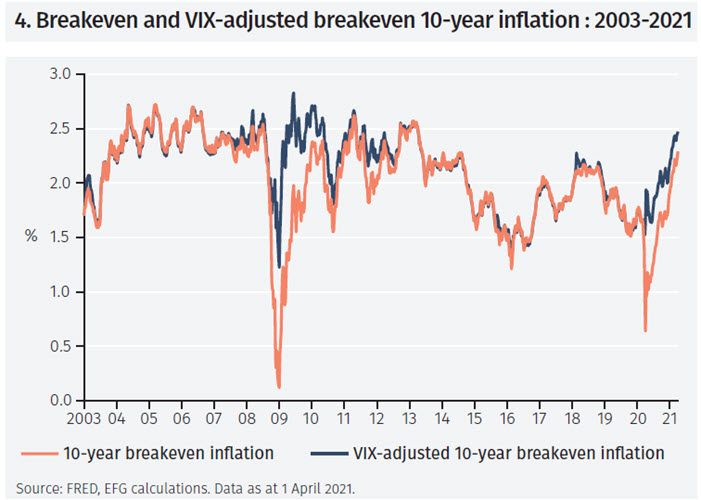
To interpret breakeven inflation more easily, it is of interest to remove the influence of variations in the VIX over time. Figure 4 presents an estimate of “VIX-adjusted” 10-year breakeven inflation. The greatest divergence between the two series occurred during the week ending 21 November 2008, when the adjusted breakeven rate was 1.77% and the unadjusted breakeven inflation rate was 0.39%, leading to a difference of 1.38%. This is a material difference. There was also a large divergence between these time series in the spring of 2021 as the Covid pandemic erupted.
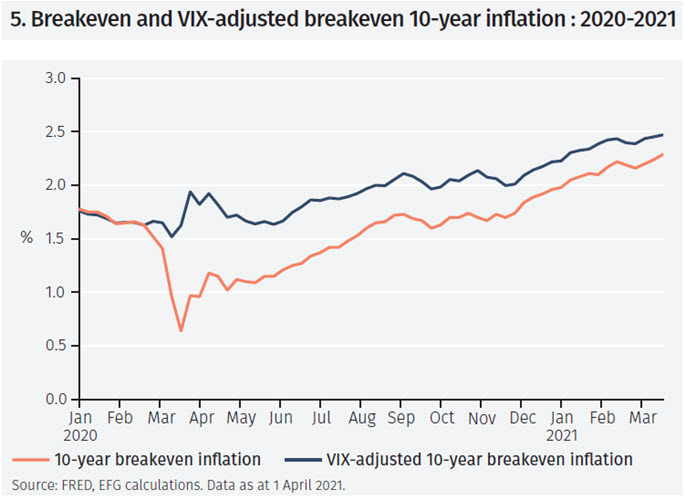
How important might changes in market tensions have been for breakeven inflation during the covid pandemic? Figure 5 provides a close-up of breakeven, and VIX-adjusted breakeven, inflation in 2020-21. In interpreting the latter series, it is important to note that it is an estimate and therefore subject to some uncertainty.
The decline of breakeven inflation as the Covid pandemic started in spring 2020, and the rise since then, appears much smaller when adjusted for variations in the VIX. While breakeven inflation rose by 1.65% between March 2020 and March 2021, VIX-adjusted breakeven inflation rose by 0.93%. Thus, adjusting for the state of financial markets reduces the increase in expected inflation almost by half. That said, the estimate of the breakeven inflation rate is about 0.2% higher at the end of the time period considered.
The foregoing analysis leads to several conclusions. First, breakeven inflation falls in periods of financial market stress and rises when such episodes end. While expected inflation has surely increased since the spring of 2020, it has done so by far less than breakeven inflation suggests. Second, while adjusting breakeven inflation for changes in the VIX has a large effect during peiods of market stress, it is clear that expected inflation has been generally lower after 2014 as the Fed has struggled to keep inflation close to its 2% objective.
Footnotes
1 See ‘Strengthening the recovery: The need for speed’, OECD Economic Outlook, Interim Report, March 2021, available at https://www.oecd.org/economic-outlook/march-2021/
2 However, the FOMC member’s projections for real GDP growth and inflation in 2022-23 were virtually unchanged, as was the projection for the federal funds rate. The projections are available here: www.federalreserve.gov/monetarypolicy/fomccalendars.htm
3 For a discussion of inflation expectations and monetary policy, see ‘Inflation expectations and the conduct of monetary policy’, Speech by Benoît Coeuré at the SAFE Policy Center, Frankfurt, July 2019, available at https://www.ecb.europa.eu/press/key/date/2019/html/ecb.sp190711~6dcaf97c01.en.html
4 The data are averages for the week ending Friday.
Important Information
The value of investments and the income derived from them can fall as well as rise, and past performance is no indicator of future performance. Investment products may be subject to investment risks involving, but not limited to, possible loss of all or part of the principal invested.
This document does not constitute and shall not be construed as a prospectus, advertisement, public offering or placement of, nor a recommendation to buy, sell, hold or solicit, any investment, security, other financial instrument or other product or service. It is not intended to be a final representation of the terms and conditions of any investment, security, other financial instrument or other product or service. This document is for general information only and is not intended as investment advice or any other specific recommendation as to any particular course of action or inaction. The information in this document does not take into account the specific investment objectives, financial situation or particular needs of the recipient. You should seek your own professional advice suitable to your particular circumstances prior to making any investment or if you are in doubt as to the information in this document.
Although information in this document has been obtained from sources believed to be reliable, no member of the EFG group represents or warrants its accuracy, and such information may be incomplete or condensed. Any opinions in this document are subject to change without notice. This document may contain personal opinions which do not necessarily reflect the position of any member of the EFG group. To the fullest extent permissible by law, no member of the EFG group shall be responsible for the consequences of any errors or omissions herein, or reliance upon any opinion or statement contained herein, and each member of the EFG group expressly disclaims any liability, including (without limitation) liability for incidental or consequential damages, arising from the same or resulting from any action or inaction on the part of the recipient in reliance on this document.
The availability of this document in any jurisdiction or country may be contrary to local law or regulation and persons who come into possession of this document should inform themselves of and observe any restrictions. This document may not be reproduced, disclosed or distributed (in whole or in part) to any other person without prior written permission from an authorised member of the EFG group.
This document has been produced by EFG Asset Management (UK) Limited for use by the EFG group and the worldwide subsidiaries and affiliates within the EFG group. EFG Asset Management (UK) Limited is authorised and regulated by the UK Financial Conduct Authority, registered no. 7389746. Registered address: EFG Asset Management (UK) Limited, Leconfield House, Curzon Street, London W1J 5JB, United Kingdom, telephone +44 (0)20 7491 9111.