- Date:
The recent burst of inflation in the US and in many other countries has led investors to wonder whether the entire inflation environment has changed.
The Beveridge curve – the relationship between the rate of unemployment and the vacancy rate – plays an important role in judging the state of the labour market. Perhaps surprisingly, despite the unemployment rate fluctuating around historical lows between 3-4% and the vacancy rate at historical highs around 7%, the US labour market is not doing too well, as outlined by Stefan Gerlach in this note.
Figure 1 shows the Beveridge curve for the US, using data for the period January 2001 to July 2009.1 The vertical axis shows the vacancy rate, that is, the number of jobs available divided by the size of the labour force.2 The horizontal axis shows the unemployment rate.
The figure shows an inverse and nonlinear relationship – the Beveridge curve – between the two variables: as the unemployment rate increases, the vacancy rate falls but at a declining rate.3 This relationship arises through a process that matches jobseekers with vacant positions.
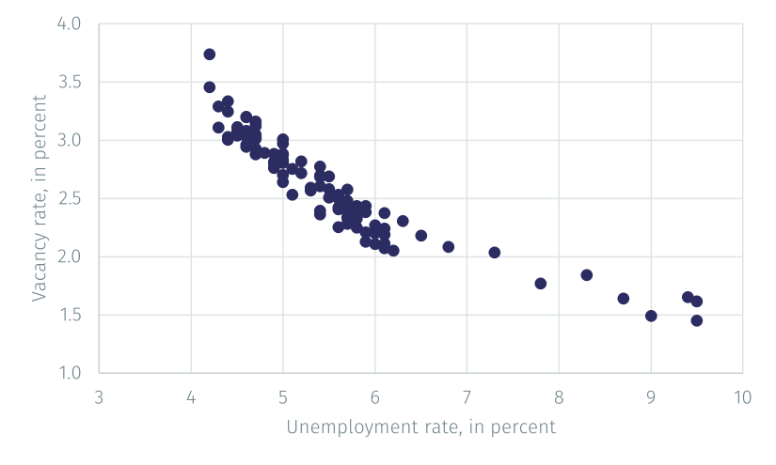
Source: EFG calculations on data from FRED. Data as of 15 August 2022.
To understand the intuition behind the Beveridge curve, consider a business cycle downturn (and disregard the fact that workers that are employed sometimes look for new jobs). With weak economic activity, many workers will have lost their jobs and few companies will have open positions to fill. But with many workers looking for employment, it is easy for firms that want to hire to find workers. Positions therefore stand vacant for short periods of time and at any point in time few positions are vacant.
The situation is the opposite in a business cycle expansion: many firms want to find new workers but there are few workers unemployed. It is therefore difficult for them to find good matches for their vacant positions, leading to long search times and therefore to many vacant positions at any point in time. As these thought experiments indicate, business cycle fluctuations will trace out the Beveridge curve.
However, the Beveridge curve can shift over time because of changes in the process matching workers looking for jobs with firms seeking workers. Suppose that this matching worsens.
That could happen for many reasons. For instance, firms may increasingly be looking for workers with specialised skills. Since they are difficult to find, positions may be vacant for longer periods of time. Or workers may be choosier in accepting job offers. During Covid workers were reported to have avoided jobs with frequent customer contact, to have been unusually willing to retire because of the risk of contagion, and to postpone job searches because of difficulties obtaining childcare.
Overall, for whatever reason, if the matching process functions were to function less well, there would be higher number of vacant positions at any unemployment rate, that is, the Beveridge curve will shift outward.
To explore potential shifts in the Beveridge curve, the figure below shows scatter plots of the vacancy and unemployment rates for three periods:
- January 2001 – July 2009. This period starts before, and ends at the peak of, the Global Financial Crisis (GFC).
- August 2009 – March 2020. This period spans the recovery period after the GFC and ends with the peak of Covid.
- April 2020 – May 2022. This period covers the labour market recovery from the Covid pandemic.
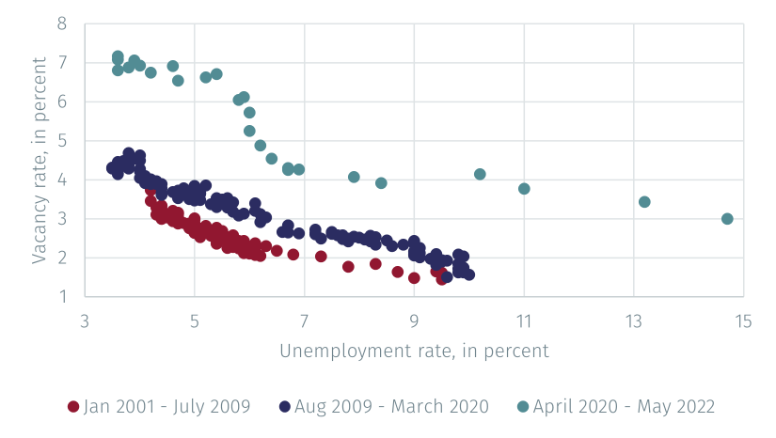
Source: EFG calculations on data from FRED. Data as of 15 August 2022.
The key lesson from the graph is that the Beveridge curve shifted out after each crisis. Thus, the mechanism matching unemployed workers with vacant positions appears to have worked increasingly poorly after each period of labour market turbulence. It is in this sense that the US labour market is functioning less well now than in the past.
1 Regrettably, the data on vacancies start only in December 2000.
2 The size of the labour force is computed from data on the total number of unemployed and the unemployment rate.
3 This non-linearity arises because neither the vacancy rate nor the unemployment rate can be negative.
Important Information
The value of investments and the income derived from them can fall as well as rise, and past performance is no indicator of future performance. Investment products may be subject to investment risks involving, but not limited to, possible loss of all or part of the principal invested.
This document does not constitute and shall not be construed as a prospectus, advertisement, public offering or placement of, nor a recommendation to buy, sell, hold or solicit, any investment, security, other financial instrument or other product or service. It is not intended to be a final representation of the terms and conditions of any investment, security, other financial instrument or other product or service. This document is for general information only and is not intended as investment advice or any other specific recommendation as to any particular course of action or inaction. The information in this document does not take into account the specific investment objectives, financial situation or particular needs of the recipient. You should seek your own professional advice suitable to your particular circumstances prior to making any investment or if you are in doubt as to the information in this document.
Although information in this document has been obtained from sources believed to be reliable, no member of the EFG group represents or warrants its accuracy, and such information may be incomplete or condensed. Any opinions in this document are subject to change without notice. This document may contain personal opinions which do not necessarily reflect the position of any member of the EFG group. To the fullest extent permissible by law, no member of the EFG group shall be responsible for the consequences of any errors or omissions herein, or reliance upon any opinion or statement contained herein, and each member of the EFG group expressly disclaims any liability, including (without limitation) liability for incidental or consequential damages, arising from the same or resulting from any action or inaction on the part of the recipient in reliance on this document.
The availability of this document in any jurisdiction or country may be contrary to local law or regulation and persons who come into possession of this document should inform themselves of and observe any restrictions. This document may not be reproduced, disclosed or distributed (in whole or in part) to any other person without prior written permission from an authorised member of the EFG group.
This document has been produced by EFG Asset Management (UK) Limited for use by the EFG group and the worldwide subsidiaries and affiliates within the EFG group. EFG Asset Management (UK) Limited is authorised and regulated by the UK Financial Conduct Authority, registered no. 7389746. Registered address: EFG Asset Management (UK) Limited, Park House, 116 Park Street, London W1K 6AP, United Kingdom, telephone +44 (0)20 7491 9111.