- Date:
Infocus - Does the war in Ukraine and the associated sanctions on the Russian economy risk tipping the world into stagflation? Stefan Gerlach looks at the historical record and argues that while it is a possibility, whether it will happen depends on how long the war and the sanctions last.
Does the war in Ukraine and the associated sanctions on the Russian economy risk tipping the world into stagflation? In this edition of Infocus, EFG chief economist Stefan Gerlach looks at the historical record and argues that while it is a possibility, whether it will happen depends on how long the war and the sanctions last.
With energy and commodity prices surging, it is natural to ask if the global economy is at risk of a 1970s-style stagflation with growth around zero and high inflation. Shocks causing stagflation are rare events. To assess the probability of stagflation, it is therefore necessary to look at the historical record.
Growth and inflation
Figure 1 shows real GDP growth and CPI inflation for all OECD countries, which are 38 of the most important economies worldwide.1 Three episodes stand out.
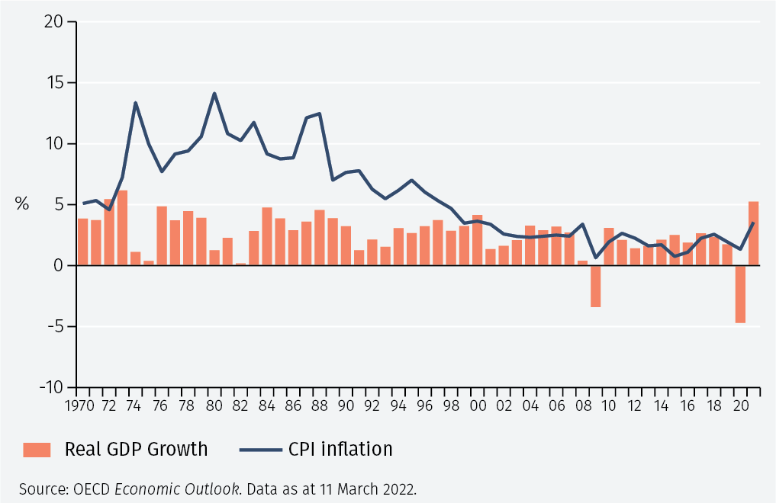
The first of these is the collapse in growth to almost zero alongside a surge in inflation in 1974-75 and 1980-82. These periods define stagflation as a combination of stagnating or zero growth and high inflation. The second episode is the onset of the global financial crisis in 2009.2 On this occasion growth turned negative but inflation fell, indicating that a different shock was acting on the global economy. Finally, the third episode is the Covid crisis, with growth turning sharply negative in 2020 but inflation unaffected, and both growth and inflation being strong in 2021.
The graph shows how the world economy has responded to underlying economic shocks and disturbances. To gain more understanding, it is important to ask what factors caused these fluctuations in growth and inflation.
Aggregate supply and demand shocks
It is useful to make a distinction between shocks (or unexpected disturbances) to aggregate demand and shocks to an economy’s aggregate supply capacity for goods and services.
- Sharp falls in aggregate demand reduce the volume of goods and services purchased and lower their prices.
- Reductions in aggregate supply lower the volume of goods and services produced and sold, but raise their prices.
This analysis suggests that while the Global Financial Crisis in 2009 is best seen as reflecting a very large demand shock, the stagflation of 1974-75 was caused by a contractionary aggregate supply shock that slowed growth to about zero and pushed up inflation. The cause of this supply shock was the surge in oil prices, which rose by more than 200% between the summer of 1973 and the end of 1974 from USD 3.56 per barrel to USD 10.11 by December.3 Similarly, between January 1979 and the summer of 1980 they rose by another 166% from USD 14.85 to USD 39.50.
These dramatic oil price increases led to an abrupt increase in firms’ productions costs, a collapse of their profitability and a massive sell-off in equity markets. They also increased the costs of transportation and heating for consumers, depleting their purchasing power and exacerbating the downturn.
A model
To understand better the consequences of these supply and demand shocks, a simple empirical model can be helpful.4 The model provides estimates of how the economy responds to supply and demand shocks.
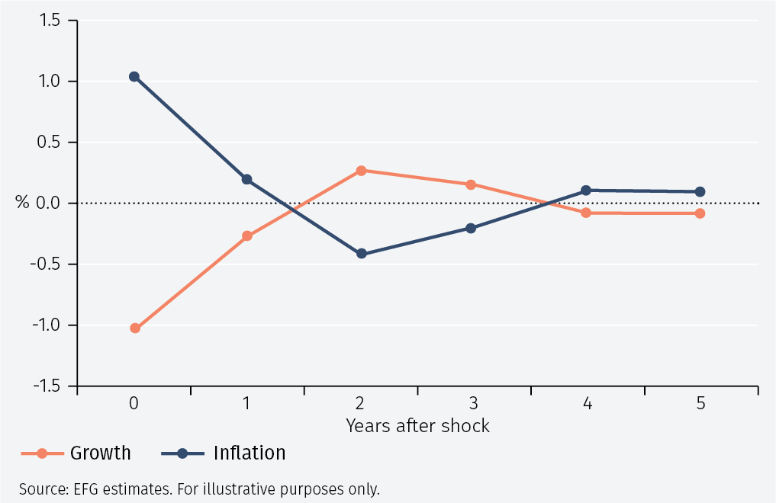
Figure 2 shows that an ‘ordinary’ contractionary supply shock reduces global real GDP growth by almost 1% and raises inflation by an equal amount.5 The effects of the shock are transitory and already after a year the impacts on growth and inflation are largely gone.
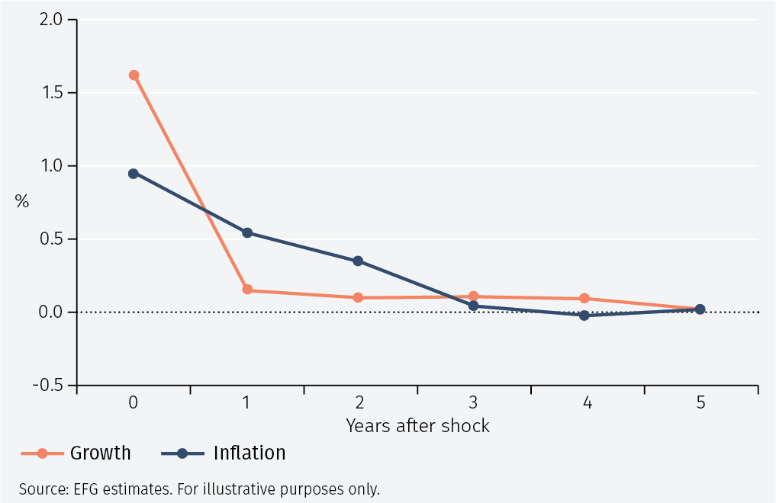
Turning to the impact of a positive demand shock, Figure 3 shows that it boosts real growth only in the year it occurs. The impact on inflation however is more protracted and remains important also the year after the shock.
The model also produces estimates of the scale of the historical aggregate supply and demand shocks. These confirm the analysis above. Thus, the surge in oil prices that started in the summer of 1973 and continued until the end of 1974 is interpreted as being due to a very large and contractionary aggregate supply shock.6 Similarly, a large and contractionary supply shock occurred in 1980.
Interestingly, the analysis shows that demand fell off between 1973 and 1975 and between 1979 and 1982. Here monetary policy appears to have played a role as the Fed raised interest rates from (an annual average of) 4.4% in 1972 to 10.5% in 1974, before cutting them to 5.8% in 1975. Similarly, the Fed pushed up rates from 7.9% in 1978 to 16.4% in 1981, before gradually cutting them.
Turning to the start of the Global Financial Crisis, the model views this as caused by a collapse in the demand for goods and services in 2009 (see Figure 4).
Finally, the Covid pandemic is seen as causing a collapse in both aggregate supply and aggregate demand in 2020. Such a combination of shocks will magnify the fall in real GDP growth but will have offsetting effects on inflation, leaving the inflation rate broadly unaffected. The model views the rise in inflation and growth in 2021 as being due to a sharp increase in aggregate demand for goods and services.
The risk of stagflation?
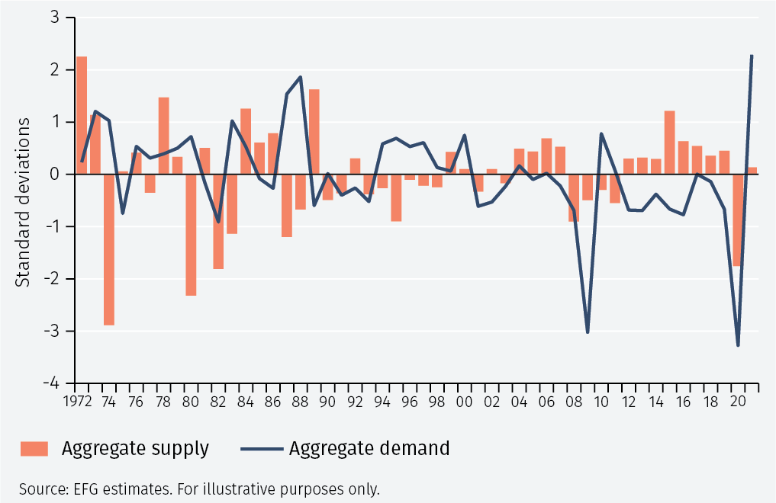
The very large oil shocks in 1974 and 1980, both of which can be thought of as aggregate supply shocks, appear to have triggered the single episode of stagflation in the last half century. How likely are such large contractionary aggregate supply shocks that reduce growth to zero to occur? Looking at the size, as measured by their ‘standard deviation’ of the estimated aggregate supply and demand shocks, it becomes possible to estimate how likely they are to happen.
The estimates indicate that the aggregate supply shock was 2.9 standard deviations large in 1974 and 2.3 standard deviations large in 1980. The table below shows that shocks that are one standard deviation large occur 19% of the time or on average every 5 years.7 Shocks that are two standard deviations large occur 6% of the time or on average every 17 years. Finally, shocks that are three standard deviations large occur 2% of the time or on average every 50 years. As discussed below, these define a benign, a benchmark and an adverse scenario.
While the war in Ukraine and the associated sanctions have led to a large shock to the global economy, a judgement must be made as to how large that shock is. While plainly large, it does not seem larger than the shock of 1974. At the same time, it does seem greater than a standard business cycle event.
In the analysis below, the benchmark is a two standard deviations large disturbance that happens roughly every twenty years. Results will also be shown for a benign scenario in which the shock is only one standard deviation large and for an adverse scenario in which the shock is three standard deviations large.
It is, of course, difficult to know how large the current shock is. While views will vary, the scenarios described above will likely cover the range of plausible outcomes.
Contractionary aggregate supply shocks
The macroeconomic effects of the shocks are thus one, two or three times the effect of the shock shown in Figure 2. Figure 5 shows that the effect is to depress real GDP growth (relative to where it would otherwise have been) by about two percentage points in the year the shock happens. The benign shock depresses real GDP growth by around one percentage point; the adverse shock depresses it by three percentage points. The effect dissipates quickly and after a year much of the impact is gone.
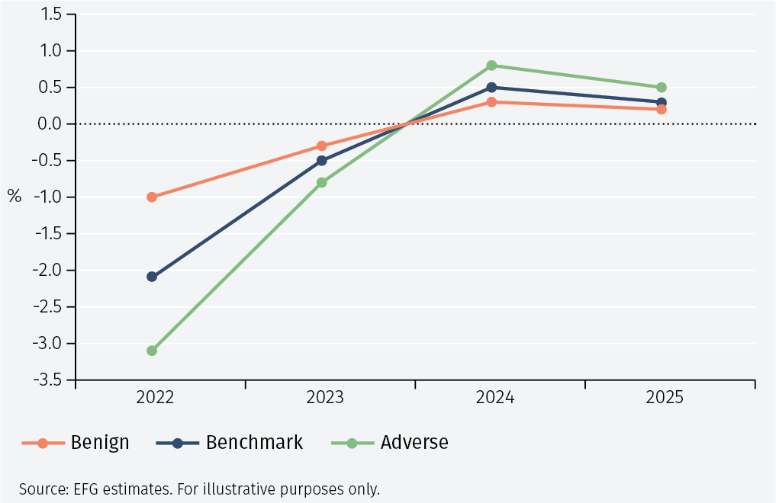
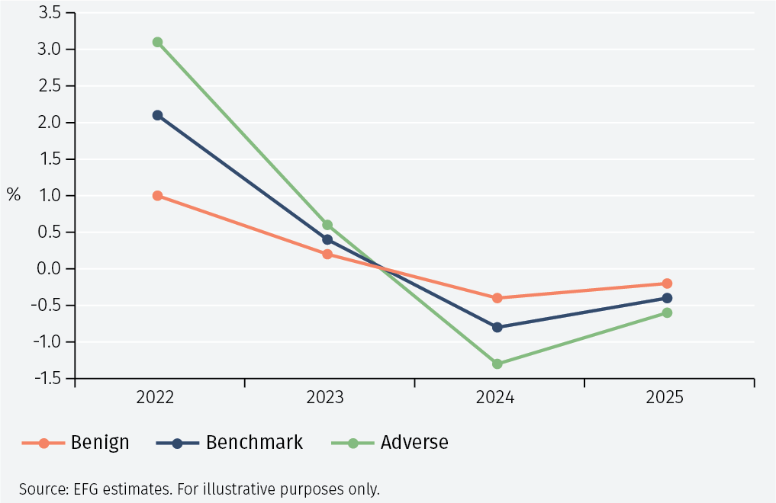
Figure 6 shows a contractionary aggregate supply shock raises inflation (relative to where it would otherwise have been) by roughly one to three percentage points, dependent on what scenario is considered. The effect on inflation is also temporary as much of the impact is gone after a year.
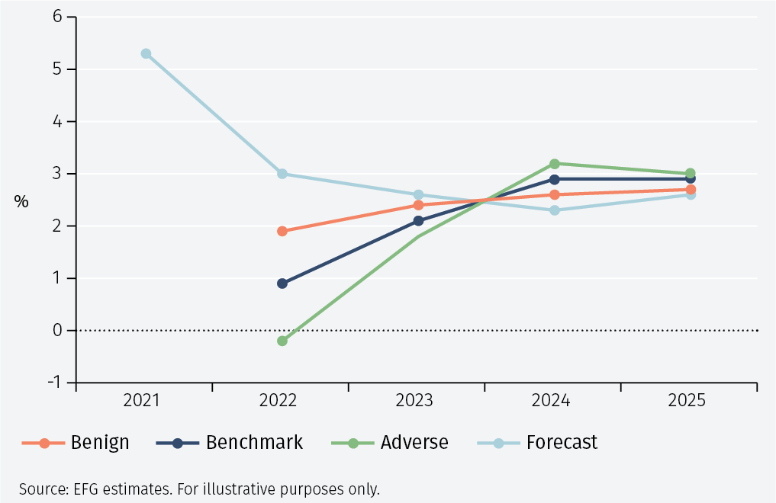
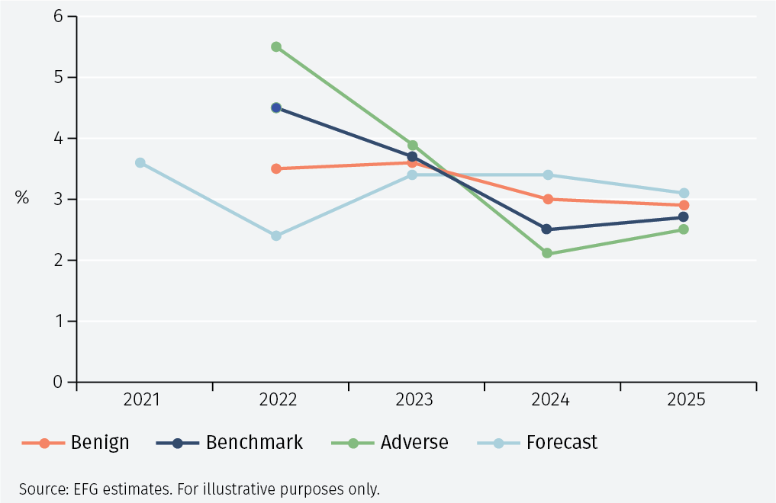
To consider the effect on absolute real GDP growth and CPI inflation in the OECD area, the estimates above for the three scenarios in Figures 5 and 6 can be subtracted from a forecast made under the assumption of no contractionary aggregate shock. As shown in the graphs below, such a forecast suggests that growth and inflation would both fluctuate around three per cent once the Covid shock has worked itself through the economy. Figures 7 and 8 overleaf show that GDP growth could fall below 1% and inflation could rise to about 4.5% in 2022 under the benchmark scenario. In the benign case, the impact would be to reduce growth to about 2% and raise inflation to about 3.5%; in the adverse case the OECD economy would contract, and inflation be pushed up to 5.5%.
Conclusions
Shocks leading to stagflation are rare. They are best thought of as contractionary aggregate supply shocks that restrict the economy’s capacity to supply goods and services at the current price level. By raising costs for firms, they lead growth to fall to around zero and to higher inflation.
The war in Ukraine and the sanctions on the Russian economy plainly constitute a global aggregate supply shock. The question is whether it will be large enough to reduce growth to zero. That, of course, depends on how long the war and sanctions last, and how severe they will turn out to be. It is difficult to judge this at present.
One guess is that the impact will be consistent with a once-in-twenty years’ supply shock. If so, the event may reduce growth and raise CPI inflation in the OECD area, both by about 2%. Growth will thus be low but positive. The effects are unlikely to be long-lasting unless, of course, the war and the sanctions are protracted. In that case growth may indeed fall to zero. Time will tell.
1 Most of the 38 OECD members are from Europe: Austria, Belgium, Czech Republic, Denmark, Estonia, Finland, France, Germany, Greece, Hungary, Iceland, Ireland, Italy, Latvia, Lithuania, Luxembourg, Netherlands, Norway, Poland, Portugal, Slovak Republic, Slovenia, Spain, Sweden, Switzerland, and the United Kingdom. There are five countries from the Americas: Canada, Chile, Colombia, Mexico, Costa Rica, and the United States. The four Pacific members are Australia, Japan, Korea, and New Zealand. The two member countries from the Middle East are Israel and Turkey.
2 The crisis started with the collapse of Lehman Brothers on 15 September 2008.
3 Data for West Texas Intermediate from FRED as at 10 March 2022.
4 The model is a VAR(2) model estimated on real GDP growth and inflation. The supply shocks are identified by the assumption that the price elasticity of the aggregate demand schedule is minus unity. This implies that aggregate supply shocks move growth and inflation in opposite directions but by an equal amount. Since the average rate of inflation was higher in the 1970s and 80s than in the rest of the period, a HP trend is subtracted from inflation for the period 1970-1989 and a mean 3.65% (the rate of inflation in 2000) is added. This has little impact on the estimated supply and demand shocks, but of course reduces the estimated persistence of shocks.
5 By ‘ordinary’, a one standard deviation shock is meant.
6 In general, there is a slight delay between the shocks and their impact on the economy.
7 These calculations assume that the shocks follow a t-distribution with four degrees of freedom.
Important Information
The value of investments and the income derived from them can fall as well as rise, and past performance is no indicator of future performance. Investment products may be subject to investment risks involving, but not limited to, possible loss of all or part of the principal invested.
This document does not constitute and shall not be construed as a prospectus, advertisement, public offering or placement of, nor a recommendation to buy, sell, hold or solicit, any investment, security, other financial instrument or other product or service. It is not intended to be a final representation of the terms and conditions of any investment, security, other financial instrument or other product or service. This document is for general information only and is not intended as investment advice or any other specific recommendation as to any particular course of action or inaction. The information in this document does not take into account the specific investment objectives, financial situation or particular needs of the recipient. You should seek your own professional advice suitable to your particular circumstances prior to making any investment or if you are in doubt as to the information in this document.
Although information in this document has been obtained from sources believed to be reliable, no member of the EFG group represents or warrants its accuracy, and such information may be incomplete or condensed. Any opinions in this document are subject to change without notice. This document may contain personal opinions which do not necessarily reflect the position of any member of the EFG group. To the fullest extent permissible by law, no member of the EFG group shall be responsible for the consequences of any errors or omissions herein, or reliance upon any opinion or statement contained herein, and each member of the EFG group expressly disclaims any liability, including (without limitation) liability for incidental or consequential damages, arising from the same or resulting from any action or inaction on the part of the recipient in reliance on this document.
The availability of this document in any jurisdiction or country may be contrary to local law or regulation and persons who come into possession of this document should inform themselves of and observe any restrictions. This document may not be reproduced, disclosed or distributed (in whole or in part) to any other person without prior written permission from an authorised member of the EFG group.
This document has been produced by EFG Asset Management (UK) Limited for use by the EFG group and the worldwide subsidiaries and affiliates within the EFG group. EFG Asset Management (UK) Limited is authorised and regulated by the UK Financial Conduct Authority, registered no. 7389746. Registered address: EFG Asset Management (UK) Limited, Leconfield House, Curzon Street, London W1J 5JB, United Kingdom, telephone +44 (0)20 7491 9111.