- Date:
DO HIGH PAST STOCK RETURNS SIGNAL HIGH FUTURE STOCK RETURNS?
Whether a positive stock market return in one month impacts the outlook for returns over the next few months has been hotly debated by financial economists for some time and is one factor that might influence practical asset allocation decisions. In this edition of Infocus, EFG Chief Economist Stefan Gerlach reviews the evidence, looking at data for 37 economies.
In making asset allocation decisions, portfolio managers consider a very broad range of information to help judge the prospects for future asset returns. For instance, the state of the business and policy cycles, relative valuations within and across asset classes, investors’ sentiment and exposure and money flows are all potentially important.
Among financial economists there is a long-standing debate about the usefulness of past returns – that is, a very narrow and restricted set of information – in forming judgments about potential future returns. A much-studied question in this debate is whether a positive return on the broad stock market in one month raises, leaves unaffected or reduces the expected return on the broad market the next few months. That question is of interest for several reasons.
First, it is sometimes argued by market commentators that financial markets follow fads. Under this interpretation, asset prices gradually rise over an extended period of time. In such a situation, a high return in one period is likely to lead to another high return in a subsequent period, leading to a positive correlation of returns or what is sometimes called momentum.
Second, sometimes it is felt that markets become overextended, rising sharply for a while but then falling back as investors engage in “profit taking.” This suggests that broad equity returns may be negatively correlated.
Third, in a now outdated literature stemming from the 1970s, it was argued that the efficient use of information implied that stock prices should fluctuate around a constant mean that captured the required rate of return. While stock prices could move sharply in response to new information, this hypothesis implied that changes in stock prices were random. It is now well understood that the assumption of a constant rate of return is implausible, implying that equity returns may be correlated over time without that implying any market inefficiency.
As these arguments suggest, it is of interest to study how broad stock price changes have evolved over time. Before proceeding to such an analysis, it should be emphasised that the behaviour of the overall stock market may be quite different from the behaviour of individual stock prices. Thus,some stocks could display positive or negative correlation over time but these effects broadly cancel each other when the overall market is considered.
Are broad stock returns correlated over time?
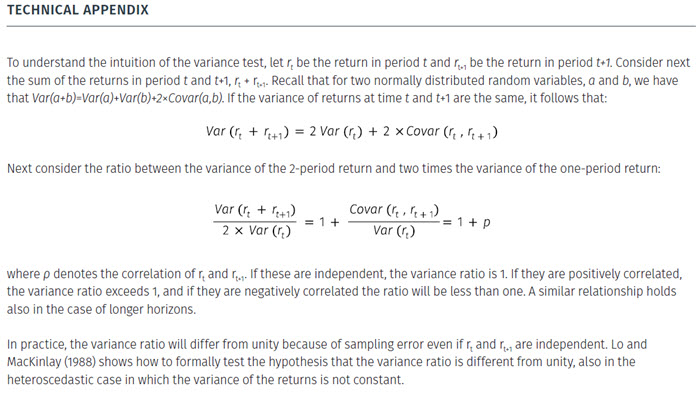
While seemingly simple, this question is quite difficult to answer for statistical reasons. Given these technical issues, recent research has often used a Variance Ratio Test to explore this issue. The test, which is discussed in the appendix, is simple and involves calculating the ratio of the variance of stock returns over a two-month period to twice the variance of returns over a one-month period. (The test can be generalised to consider longer investment horizons than two months.1)
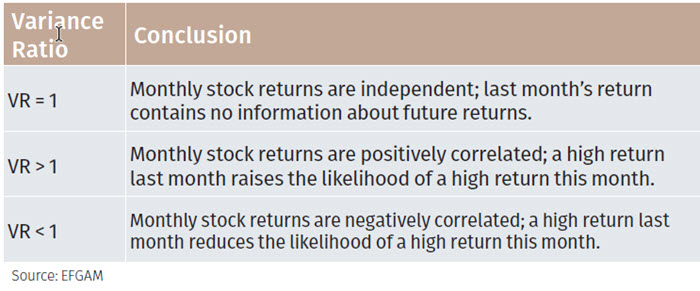
The test yields a single number given by the ratio of two variances. The results from the test can be interpreted using the table below.
Thus, the benchmark value for the variance ratio test is unity. Values above unity indicate a positive correlation of returns over time and values below unity indicate negative correlations of returns. It is of course possible that the test will be above unity for some horizons and below unity for others. For instance, it may be that a positive return on the broad stock market leads to a further month or two of positive returns but that prices then start to revert towards the initial level. If so, the variance ratio test will be above unity for short horizons but fall below unity as longer horizons are considered.
Of course, because of sampling error, the test will not yield a result of exactly unity even if monthly stock returns are truly independent of each other. A confidence band for the test must therefore be computed and used in assessing the results.
Selected results
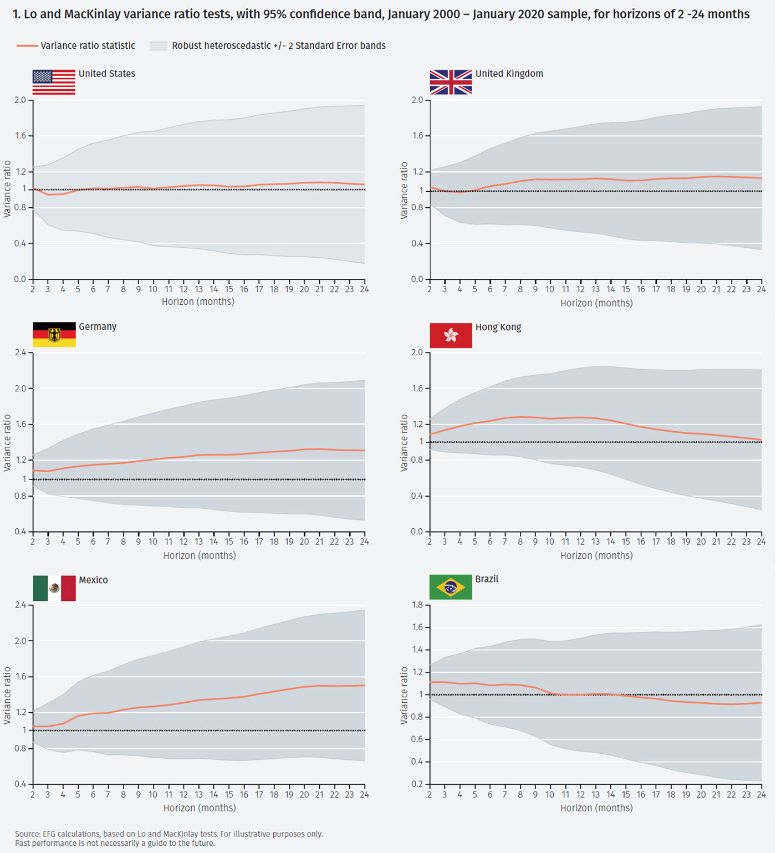
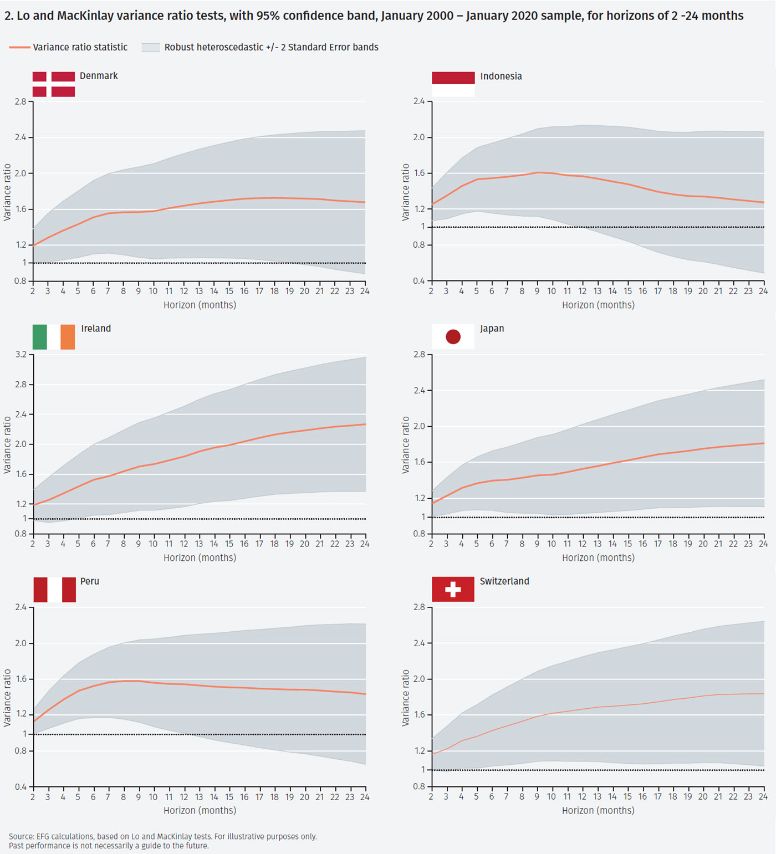
Figures 1 & 2 show the results from Lo and MacKinlay variance ratio tests together with a 95% confidence band for the sample January 2000 – January 2020, for periods of 2 to 24 months.2 While the test is computed for 37 economies – Australia, Austria, Brazil, Canada, China, Czechia, Denmark, Egypt, France, Germany, Greece, Hong Kong, Hungary, India, Indonesia, Ireland, Israel, Italy, Japan, Korea, Malaysia, Mexico, Netherlands, Norway, Peru, Philippines, Poland, Russia, Singapore, Spain, Sweden, Switzerland, Taiwan, Thailand, Turkey, UK and US – in the interest of brevity we only present results for two groups of economies.
Figure 1 shows the results for the US, UK, Germany, Hong Kong, Mexico and Brazil which are indicative for the first group, which is much the largest. In most of these economies, the variance ratio starts a little above unity for a two-month holding period and then gradually rises, suggesting a positive correlation of returns. (In the US the variance ratio never moves away from unity.) However, the confidence bands indicate the hypothesis that the variance ratio is unity cannot be rejected for any of these economies, implying that past equity returns are not useful for forecasting future returns.
The second, less numerous, group of economies, which includes those for which there is some evidence the broad stock returns are correlated over time, consists of smaller, often emerging, economies, with the notable exception of Japan. In this group of economies, the variance ratio starts a little over one, and continues to rise for at least some months, and in many cases for all horizons. In these cases, and in this sample, past performance contains some information about future returns.
Conclusions
Overall, the results suggest that while returns on broad stock indices display some limited positive correlation over time, the evidence is rarely statistically significant. In the few cases it is, it tends to be in smaller or emerging markets economies.
This finding warrants two comments.
First, this is as it should be – if stock returns were easily predictable on the basis of their past behaviour, market participants would exploit that fact and, in the process, wipe out the information content of past returns. For portfolio managers, these results are entirely as expected. Rather than focusing solely on the behaviour of past returns, they look at a myriad of information to make judgements about the likely future behaviour of stock prices.
Second, these findings say nothing about the behaviour of prices of individual stocks or sectors. Broad stock indices contain a large number of individual share prices. While some of these may display some limited correlation over time, these effects may cancel each other out when the overall market is considered.
Footnotes
1 More generally, the test is given by the ratio of the variance of returns over N months to N times the variance of returns over one month.
2 See A. W. Lo and A. C. MacKinlay, 1988, ‘Stock Market Prices Do Not Follow Random Walks: Evidence from a Simple Specification Test’, The Review of Financial Studies, 41-66.
Important Information
The value of investments and the income derived from them can fall as well as rise, and past performance is no indicator of future performance. Investment products may be subject to investment risks involving, but not limited to, possible loss of all or part of the principal invested.
This document does not constitute and shall not be construed as a prospectus, advertisement, public offering or placement of, nor a recommendation to buy, sell, hold or solicit, any investment, security, other financial instrument or other product or service. It is not intended to be a final representation of the terms and conditions of any investment, security, other financial instrument or other product or service. This document is for general information only and is not intended as investment advice or any other specific recommendation as to any particular course of action or inaction. The information in this document does not take into account the specific investment objectives, financial situation or particular needs of the recipient. You should seek your own professional advice suitable to your particular circumstances prior to making any investment or if you are in doubt as to the information in this document.
Although information in this document has been obtained from sources believed to be reliable, no member of the EFG group represents or warrants its accuracy, and such information may be incomplete or condensed. Any opinions in this document are subject to change without notice. This document may contain personal opinions which do not necessarily reflect the position of any member of the EFG group. To the fullest extent permissible by law, no member of the EFG group shall be responsible for the consequences of any errors or omissions herein, or reliance upon any opinion or statement contained herein, and each member of the EFG group expressly disclaims any liability, including (without limitation) liability for incidental or consequential damages, arising from the same or resulting from any action or inaction on the part of the recipient in reliance on this document.
The availability of this document in any jurisdiction or country may be contrary to local law or regulation and persons who come into possession of this document should inform themselves of and observe any restrictions. This document may not be reproduced, disclosed or distributed (in whole or in part) to any other person without prior written permission from an authorised member of the EFG group.
This document has been produced by EFG Asset Management (UK) Limited for use by the EFG group and the worldwide subsidiaries and affiliates within the EFG group. EFG Asset Management (UK) Limited is authorised and regulated by the UK Financial Conduct Authority, registered no. 7389746. Registered address: EFG Asset Management (UK) Limited, Leconfield House, Curzon Street, London W1J 5JB, United Kingdom, telephone +44 (0)20 7491 9111.