- Date:
Insight Q1 2021
OVERVIEW
We expect a synchronised global economic recovery in 2021, with inflation and interest rates staying low. Progress will be largely dependent on the success with bringing Covid-19 under control.
2021 synchronised rebound
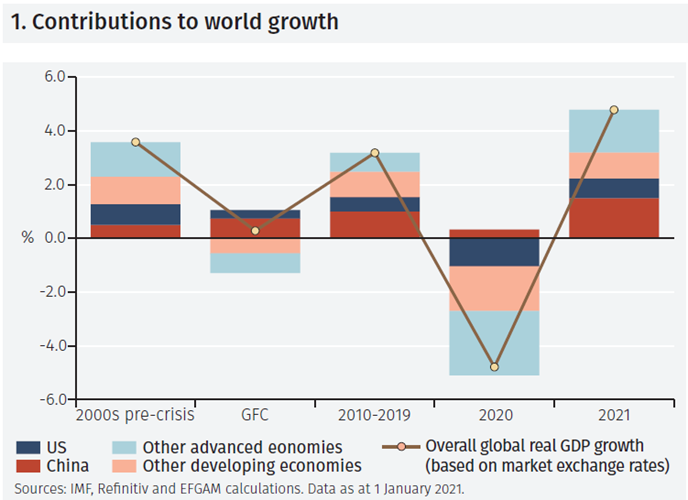
We expect a broadly synchronised global economic recovery in 2021. We see overall global GDP growth of around 5% for 2021, broadly matching the size of the decline in 2020 (see Figure 1, which shows IMF forecasts, with which we broadly concur). Economic recovery is, however, unlikely to be a smooth process. The experience of those countries which have successfully brought Covid-19 under control and reopened their economies provides encouragement. Pool parties in Wuhan, Auckland’s packed Eden Park rugby stadium and Caribbean beaches show that a rebound can come quickly, especially in the badly-hit leisure, sport and hospitality sectors.
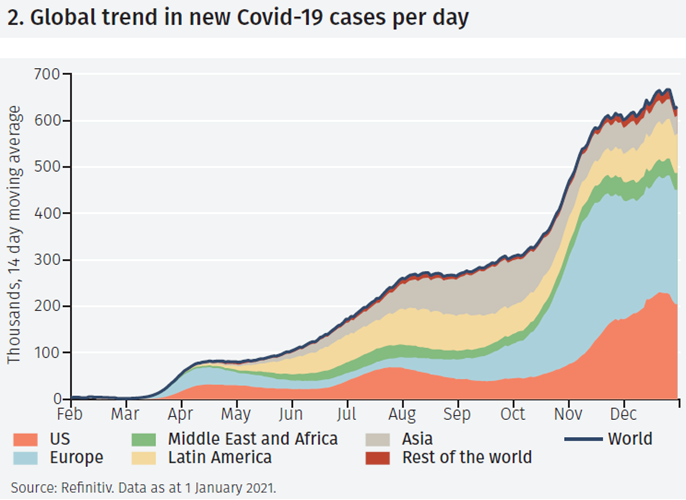
But that prospect still lies some way in the future for many economies. Late 2020 and early 2021 saw a surge in Covid-19 infections, especially in the US and the UK. Curbing Covid-19 relies on a speedy deployment of vaccines coupled with continued restraints on mobility. On a global scale, there is some tentative indication that the rate of new infections is levelling out (see Figure 2). This could mark the end of the third global wave of infections. However, some economies (such as Hong Kong) have seen a fourth wave; the virus has mutated; and the World Health Organisation has cautioned that there may be worse to come. As 2020 demonstrated so clearly, calling an end to a pandemic can be a hazardous and humbling experience.
Covid-19 and growth
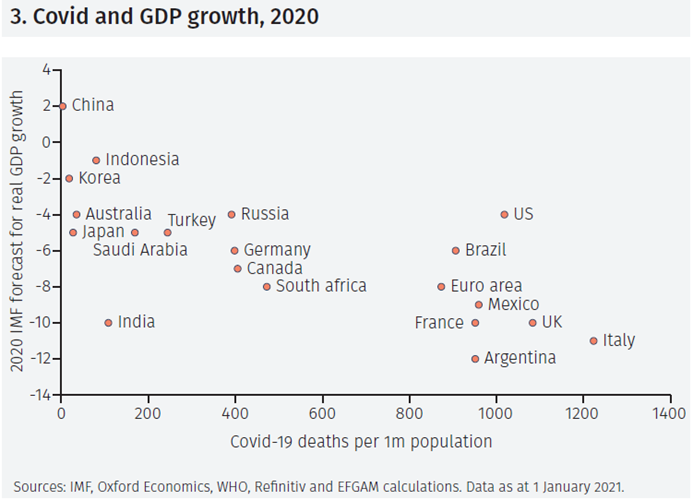
Across the G20 economies, countries with a greater severity of Covid-19 saw weaker economic growth (see Figure 3) in 2020. China, where the outbreak started, saw just 3 deaths per 100,000 population for the year and is set to register 2% real GDP growth. Italy, the second country to be hit badly, saw a OVERVIEWmortality rate 400 times higher and a GDP contraction which the IMF sees at 11% (but we think will be around 9%). However, especially when the analysis is extended from the largest economies to a broader range, the relationship is not a particularly close one. Singapore, for example, has seen just 23 deaths in its population of five million whereas US deaths now exceed 300,000. Yet, Singapore’s real GDP contraction in 2020 (6%) is set to have been more severe than that in the US (4.5%).
Government debt and borrowing costs
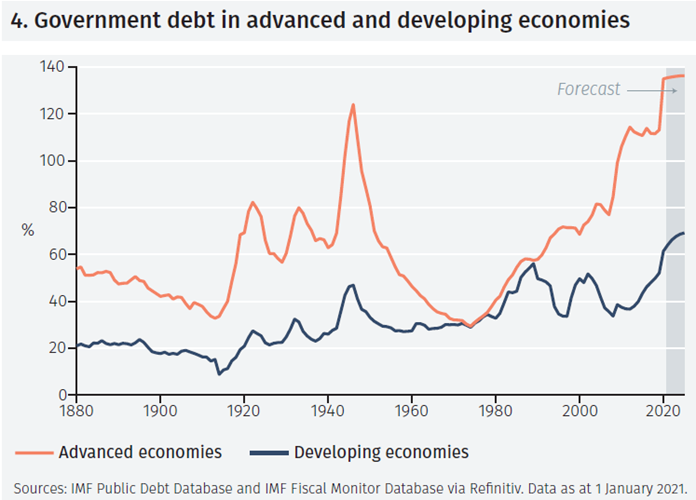
One lasting effect of the pandemic is the build-up of government debt. This exceeds previous levels in advanced and developing economies alike (see Figure 4). Many are concerned that this will lead to tax increases, new forms of taxation (such as wealth taxes in those countries that do not have them) or government spending cuts. We think such measures are unlikely. In many respects, the austerity policies which followed the global financial crisis are now seen to have been misguided. In some countries, they led to much reduced government investment spending and a consequent impairment of the supply side of the economy. In others they led to a squeeze on the pay and working conditions of lower-paid workers, many of whom (healthcare workers, care staff and delivery drivers) played vital roles in the pandemic. Attitudes have generally shifted to favour support for the poorest, less well-educated sectors of society.
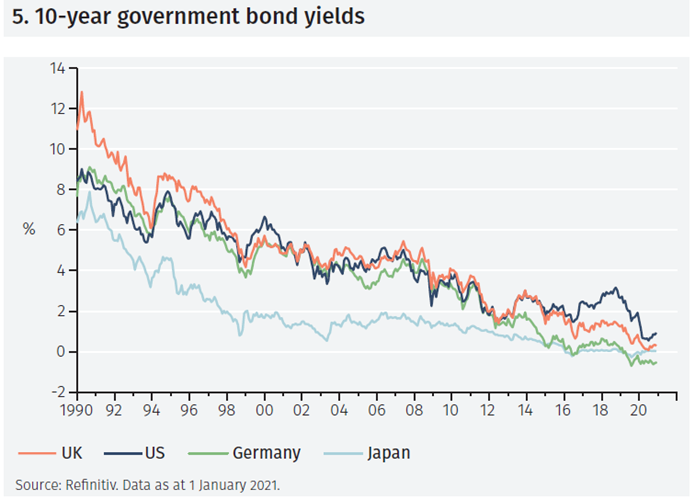
Furthermore, we expect that, with inflation rates staying low, government borrowing costs will remain low. Financing government debt looks set to remain cheap. Ten-year government bond yields are around 1% in the US (see Figure 5), close to zero in Japan and negative in Germany and other eurozone economies. In Ireland, an economy which, ten years ago, was at the epicentre of the eurozone crisis borrowing costs turned negative in late 2020.1
Pandemics and paradigm shifts
Two more fundamental effects of pandemics are noteworthy. First, as discussed in our Special Focus section on page 11, historically they have tended to be deflationary. Second, they can result in a flourishing of innovation, new technology and new ways of thinking and working. In 1665, Isaac Newton walked for three days to go home from Trinity College, Cambridge to avoid the plague. Self-isolating there for 20 months, he developed calculus, the laws of motion and much we now know about optics. He changed our way of looking at the world.2
Electrification, green technology and digitalisation, all accelerated by the pandemic, have changed, and will continue to change our world view. Pandemics can bring paradigm shifts.
US dollar prospects
The strong recovery in global stock markets from their March 2020 nadir, propelled by companies which are leaders in new technology, is indicative that such changes are being reflected in financial markets.
Some see this as a bubble, not unlike that of the early 2000s, which is destined to burst. Although overexuberance followed by correction are common features of financial markets, we doubt that they are correct in their current assessment. Many large technology companies have strong balance sheets, are profitable, have high levels of liquidity and the ability to finance new innovations. Although under some pressure from greater regulation, we see them consolidating their position in 2021. Meanwhile, small companies, where innovation is often incubated, currently find it relatively easy to obtain finance at a low cost.
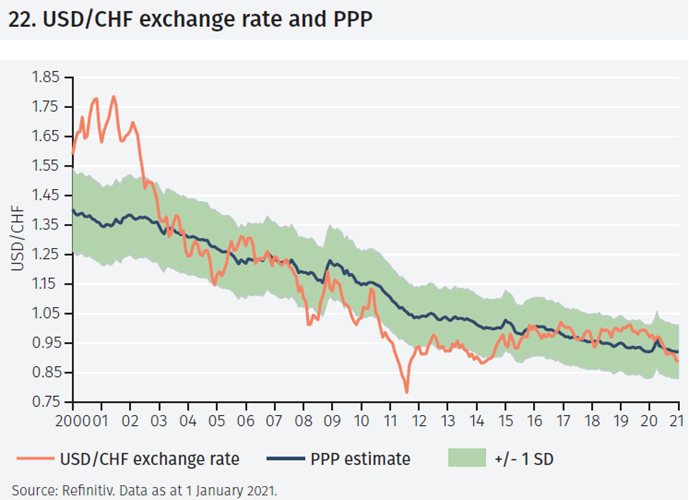
In a world which might return to a ‘new, new, normal’ in 2021, the US dollar may be set to fall further. It is moderately overvalued on our estimates of its PPP (Purchasing Power Parity) rate (see Figure 6) and demand for its safe haven may wane as other economies recover their economic momentum.
We return to these themes after a discussion of recent asset market performance.

ASSET MARKET PERFORMANCE
After the sharp sell-off in March, global equities, led by Asia and the US, recovered strongly. The US dollar’s weakness was evident against all major currencies. Global bonds registered positive returns for the year.
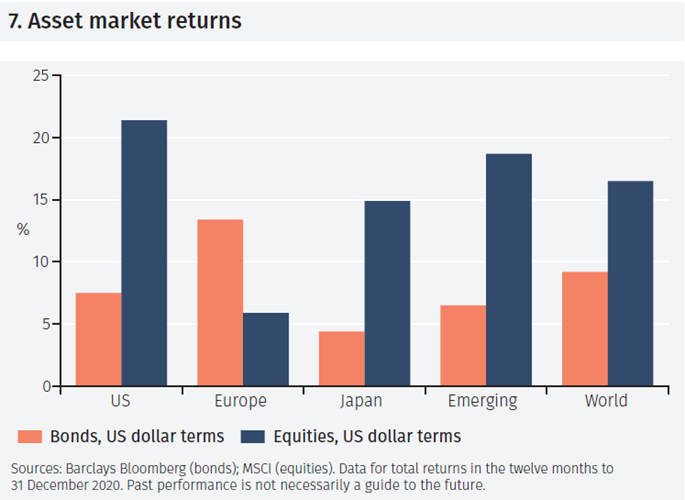
World equity markets saw gains of 16.5% in 2020 (see Figure 7) on the basis of the MSCI World Index in US$ terms. Those gains reflected a sustained recovery after the sharp weakness in the first quarter. Global bond market returns were also strong, at 9.2% on the basis of the Bloomberg Barclays Global Aggregate Index.3 Returns from the US bond market, propelled by the capital appreciation which resulted from a decline in yields, were 7.5% (measured by the Bloomberg Barclays US Aggregate Index in US dollar terms). Such a decline in yields and capital appreciation was a global phenomenon. In Europe total returns in US dollar terms were as high as 13.4%. Emerging market bonds, recovering after their poor performance in the first quarter, recorded 6.5% returns in US dollar terms.
Bond markets
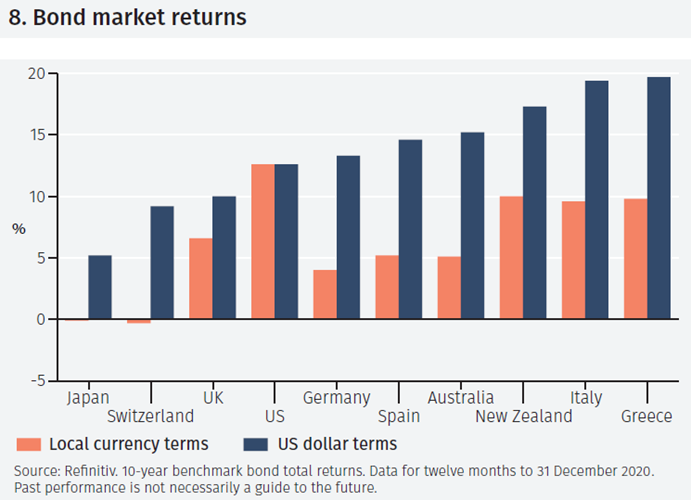
With the general decline in yields across bond maturities, longer dated bonds produced higher total returns than those with shorter maturities. The total return from US 10-year government bonds was as high as 12.6%, for example (see Figure 8). In the eurozone, local currency returns from 10-year maturity bonds ranged from 4% in Germany to almost 10% in Italy and Greece. The euro’s appreciation against the US dollar meant that returns in US dollar terms were well above 10% in all eurozone markets and almost 20% in Italy.
10-year UK government bond yields fell to just 0.24% at the end of the year, despite a substantial increase in the UK government’s new bond issuance. In normal circumstances this would be expected to raise financing costs, but it was almost completely offset by Bank of England bond purchases.
Equity markets
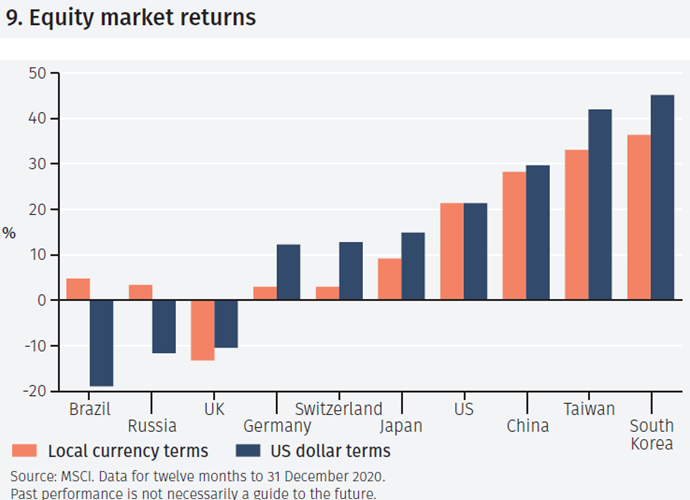
Across global equity markets, the strongest performance in 2020 came from the US and three Asian markets - China, South Korea and Taiwan (see Figure 9). In Asia, that reflected the export-led recovery in economic growth, which in turn was underpinned by the relative success in containing Covid-19. In the US, the strength of the market owed much to the performance of large technology companies, but by the end of the year there were also strong gains in small cap companies.
Brazil and Russia, both hit hard by Covid-19, saw relatively weak local currency equity market performance and currency weakness against the US dollar. The UK equity market was adversely affected by a perceived poor response to Covid-19 and concerns about Brexit, which persisted up until 24 December, when a Brexit deal was agreed.
UNITED STATES
The recovery in the US economy, which slowed in late 2020, will receive a boost in 2021 from the latest US$900bn stimulus. Meanwhile, broader policy changes are expected under President Biden.
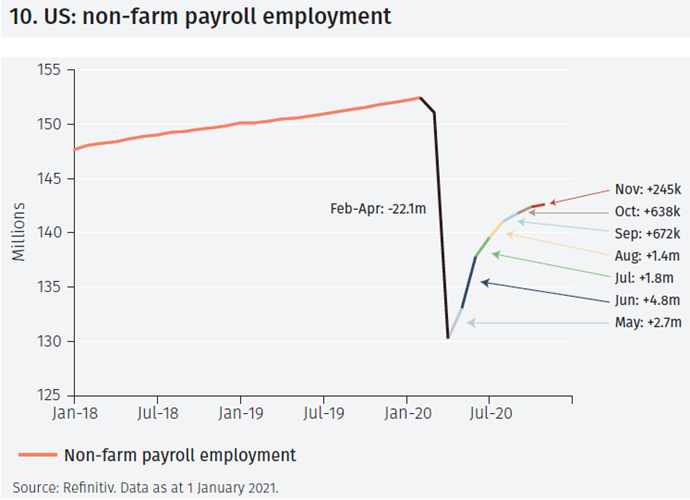
Losing momentum in late 2020
The US economy lost momentum in late 2020. One of the best indications of this is the slowing of employment gains (see Figure 10). Data on employment trends is, we think, probably more useful in judging the path of the economy than traditional measures such as GDP growth. This is because there are always difficulties in measuring the output of the services sector of the economy, particularly so in a pandemic.
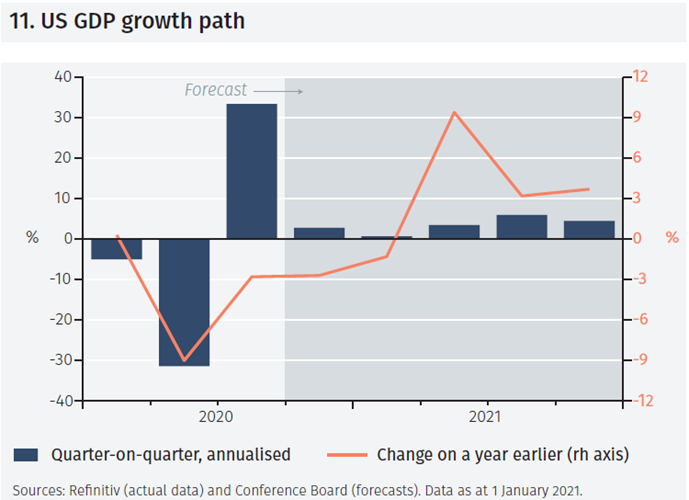
GDP growth will certainly prove somewhat volatile in the coming year, especially on the basis of the quarter-on-quarter annualised growth rate, the conventionally used measure (see Figure 11). Even for the fourth quarter of 2020, the range of forecasts for this measure is especially wide – from close to zero to almost 10%.4
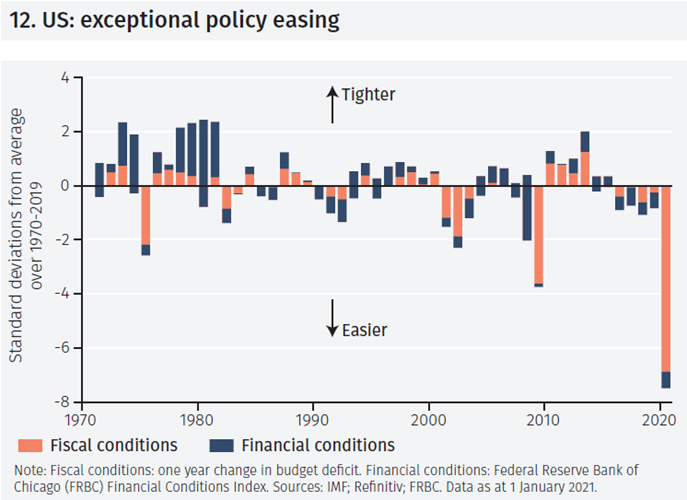
Looking ahead, the fiscal measures agreed in late 2020 will provide a stimulus amounting to around US$900bn. Although smaller than the US$2.2 trillion in April 2020 – and the further measures which took total fiscal support to US$2.7 trillion in the year – this will certainly help boost spending and economic growth in 2021. It is unrealistic to expect policy support in 2021 to be as substantial as in 2020, when the degree of combined monetary and fiscal stimulus far exceeded anything experienced since 1970 (see Figure 12).
Sugar rush and genuine improvement
In a sense, of course, such stimulus measures provide a temporary ‘sugar-rush’ to offset the Covid-related declines in activity. The direct mailing of support payments, signed by President Trump, provided an effective but transitory boost. These payments, which were means tested, were directed at the lower paid; higher paid workers who kept their jobs, meanwhile, reacted to the pandemic by spending less and saving more. It is their behaviour that will be particularly important in determining the type of recovery seen in 2021.
If the virus is contained effectively, then discretionary spending on activities that have been closed could rebound quickly.
Longer-term, we broadly welcome President Biden’s likely more consensual, cross-party, multilateral approach. Although there will be constraints on his actions (especially as, in the Senate, achieving the required ‘supermajority’ vote on finance-related bills may still be hard to achieve) we think much can be achieved by Executive Orders and measures with cross-party support. In particular, an emphasis on greening the economy could stimulate activity and generate many new jobs; and more settled trade relations with the rest of the world should be beneficial.
UNITED KINGDOM
The UK economic recovery was progressing well until it was hit by a renewed surge in Covid-19 in late 2020. Even so, there are three reasons to be optimistic about recovery as 2021 progresses.
Rebound interrupted
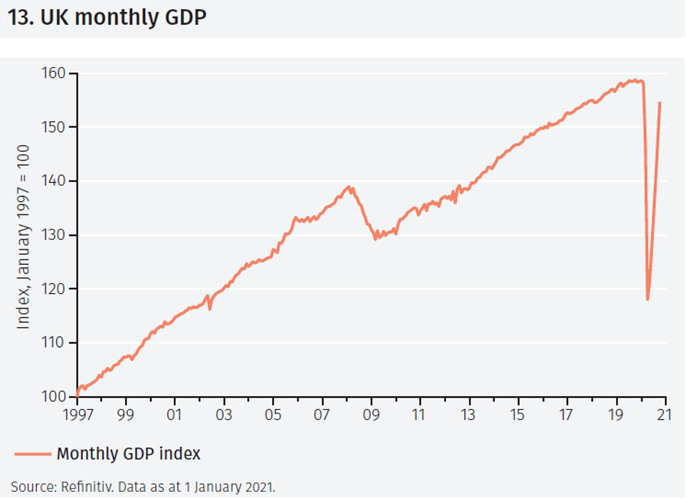
The UK economy was recovering well up until late 2020 when, in response to a surge in Covid-19 cases, particularly driven by a new strain of the virus, lockdown restrictions were intensified. With lockdowns likely to remain in place for much or all of the first quarter of 2021, there is little doubt that there will be a setback to what was a “V-shaped” recovery (see Figure 13).
However, there are three grounds for optimism about the UK recovery as 2021 evolves. Most important, the UK is set to have one of the fastest rollouts of Covid-19 vaccines in the world. Second, household savings were built up in 2020 and could be run down quite quickly as confidence returns. The savings ratio — savings as a proportion of disposable income — was as high as 26.5% in mid-2020, a level never seen in the post-war British economy. In the UK, savings have generally risen during periods of recession and economic uncertainty. In the way memorably described by Keynes as the ‘paradox of thrift’, such increased saving exacerbates the downturn. Yet, once conditions improve savings are typically quickly run down. Third, although the Brexit agreement with the EU was relatively ‘thin’, as we expected, with further details (especially for the services sector) needing clarification, the feared disruption to goods trade has been avoided. The UK is now in a position to build new trading relationships with the rest of the world; whilst maintaining good links with the 27 remaining EU countries.
Covid costs
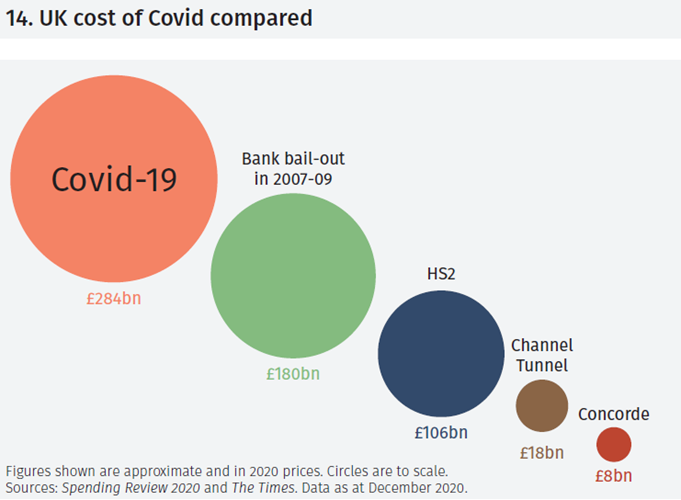
The one major concern is the impact of Covid-19 on the public finances. The direct costs, £284bn, are already higher than GDPthose of the bank bailout in 2007-09 (see Figure 14). That cost reflects higher spending on public services (particularly the National Health Service) and measures including the furlough scheme, other income support schemes, lost or delayed tax revenue, the ‘Eat Out to Help Out’ scheme and the extension of free school meals. Added to higher government spending and lower tax revenues as a result of weaker growth, the overall government budget deficit is set to reach £400bn (20% of GDP) in the fiscal year ending March 2021.
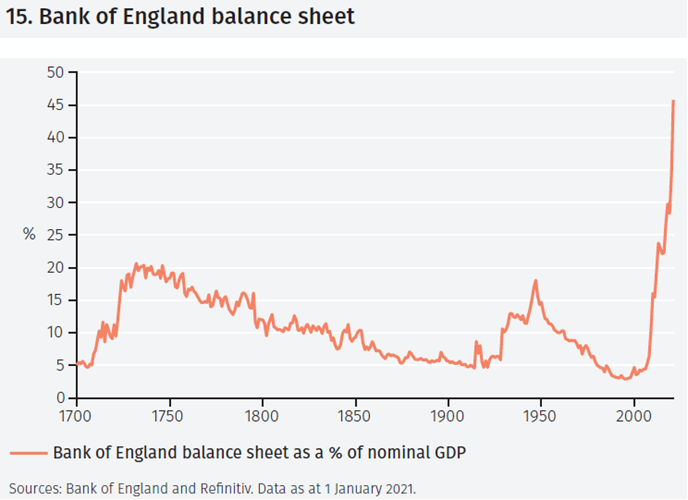
That deficit has been financed by increased government bond issuance. Although the Bank of England cannot purchase such bonds directly from the government, it has bought gilts in the secondary market. That has taken its balance sheet to £895bn, 45% of GDP (see Figure 15). Broadly, for the moment, markets remain relaxed about this.
EUROZONE
Across the eurozone, there has been a diverse experience with Covid-19, but lockdown measures were tightened across all member states in late 2020. Looking ahead, there are three challenges: on debt, inflation and demographics.
Diverse experience
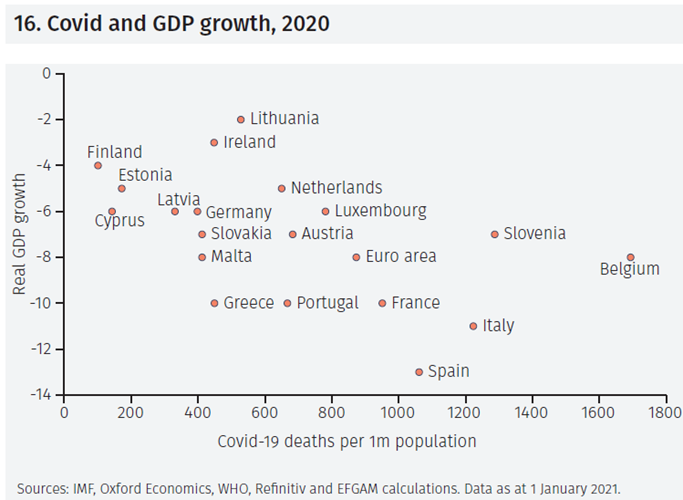
Across the eurozone, lockdown restrictions have been tightened since summer 2020; in early 2021 they were as tight as they had ever been in Germany, Greece, Lithuania and Luxembourg.5 Since the outbreak of the pandemic, four economies have death rates higher than 1000 per one million population, amongst the very highest rates in the world; but in three others the rate is less than a tenth of that (see Figure 16). Vaccine rollouts remain a source of optimism and we expect activity to rebound later in 2021. But as that happens, three longer-term challenges for the eurozone will become more evident.
Government debt levels
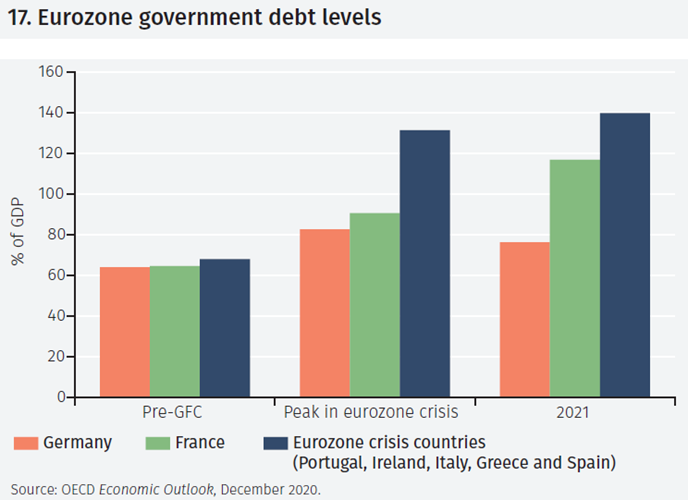
First, government debt levels have surged. Notably, in the former crisis countries (see Figure 17) debt levels exceed those in 2009/12. However, for now at least, financial markets are taking a relaxed attitude to this, with very low financing costs across all eurozone economies.
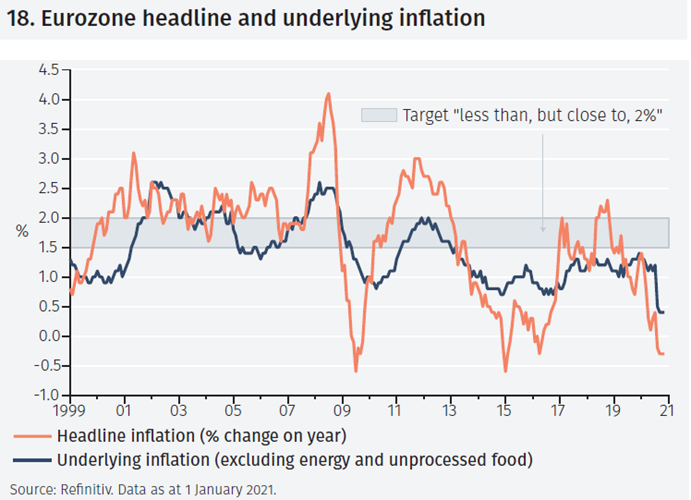
Low inflation
Second, the headline eurozone inflation rate is negative (see Figure 18). Partly, this represents errors in measurement: changing patterns of consumer spending and difficulties with price collection are estimated to have reduced the inflation rate by 0.2 percentage points since summer 2020.6 Even correcting for that, the eurozone is experiencing very low inflation or deflation. Concerns that the eurozone, like Japan, may become embroiled in a long fight against deflation have resurfaced.
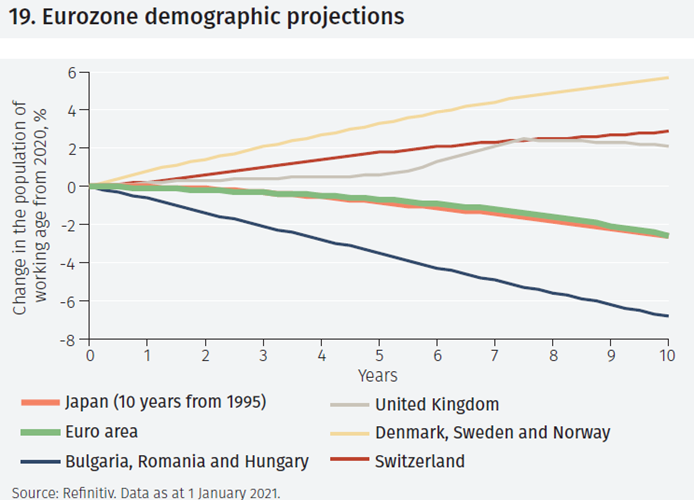
Demographics
Such a concern is exacerbated by eurozone demographic trends. Looking ahead ten years, the trajectory for the population of working age is close to that seen in Japan since its workforce peaked in the mid-1990s (see Figure 19). That is despite a further projected migration from several central and eastern European countries to northern Europe.
SWITZERLAND
The US has recently labelled Switzerland a currency manipulator. We think the designation is questionable and that it is unlikely to change the course taken by the Swiss National Bank.
Switzerland and Covid-19
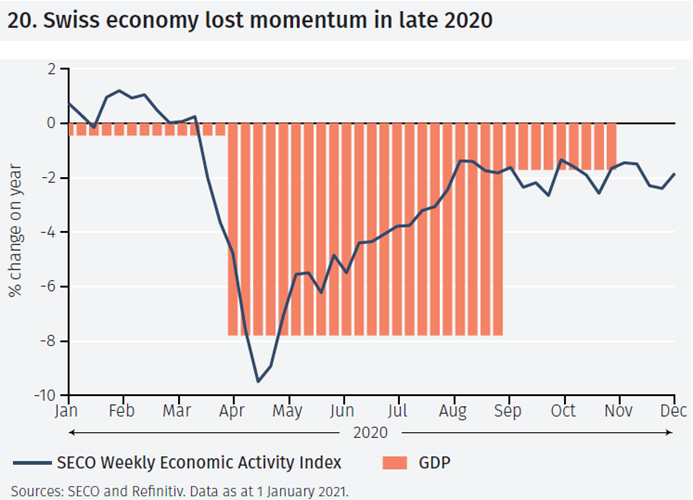
The Swiss economy has proved relatively robust in the face of the pandemic. It is expected to see a smaller hit to GDP in 2020 than, notably, the eurozone. However, the economy lost momentum in late 2020 (see Figure 20), particularly because of renewed lockdowns in Switzerland itself and the rest of Europe. Against this background, the US Treasury’s designation of Switzerland as a currency manipulator came as an unwelcome surprise.
Switzerland as a currency manipulator
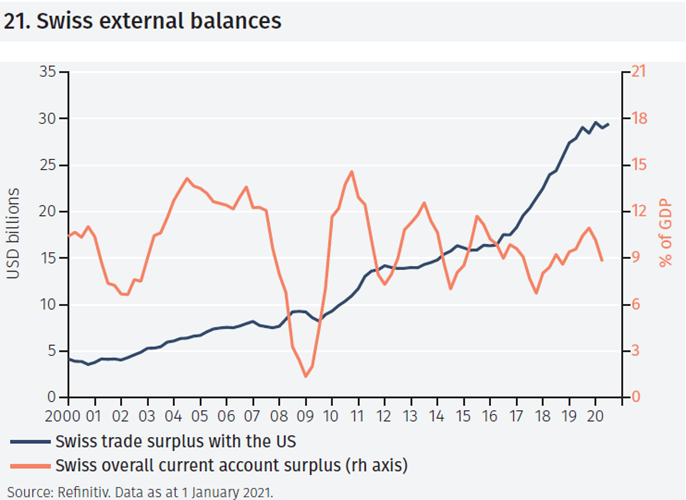
The three criteria the Treasury use for assessing whether any country is a currency manipulator are: whether it has a trade surplus with the US of more than USD20bn; a current account surplus of more than 2% of GDP; and whether there has been persistent one-sided currency intervention, amounting to more than 2% of GDP in the previous 6-12 months.
Switzerland undoubtedly met all three quantitative criteria. Its trade surplus with the US was USD29bn in the 12 months to October; its current account surplus was 8.8% of GDP in the 12 months to June (see Figure 21); and we estimate that in the 12 months to end-November the SNB purchased foreign currencies amounting to around CHF120 bn (nearly 17% of GDP).In that narrow sense, Switzerland is guilty as charged.
Mitigating factors
However, the US Omnibus Trade and Competitiveness Act of 1988 requires that, when considering if a country is a currency manipulator, a broader range of factors, including currency developments and monetary policy, should be considered.
The broader range of factors should, we think, include the fact that Switzerland’s bilateral surplus with the US is mainly due to its export of pharmaceutical goods. This is a sector in which Switzerland is among the world’s leaders: it satisfies growing US demand, especially linked to its ageing population.
As far as the currency is concerned, it cannot be argued that the Swiss franc is unwarrantedly weak. The Swiss franc has appreciated strongly against the US dollar since mid-2019 and is overvalued against it based on our Purchasing Power Parity (PPP) estimates (see Figure 22).
With respect to monetary policy, the SNB, in common with other central banks in developed economies, uses asset purchases to inject liquidity into the economy. Given the small size of the Swiss domestic bond market, however, the SNB’s only option is to buy foreign assets. Hence, the SNB’s currency interventions are targeted at meeting its monetary policy mandate rather than gaining a competitive advantage in international trade.
Although there is a risk that the US Treasury decision could hit Swiss companies, for example by leading to their exclusion from US government procurement contracts, we think President Biden is unlikely to argue strongly for such action.
ASIA
Trade tensions between Asia and the US are unlikely to ease quickly under the new US administration. Indeed, the US recently labelled Vietnam a currency manipulator. The reality is that the US and Asia are closely intertwined.
Asian trade
Trade tensions between Asia and the US are unlikely to ease quickly under President Biden. Indeed, after his victory, the US Treasury labelled Vietnam a currency manipulator, a description it had previously applied to China.7 Meanwhile, the renminbi has recently tended to appreciate (see Figure 23), without any notable pressure on China from the US.
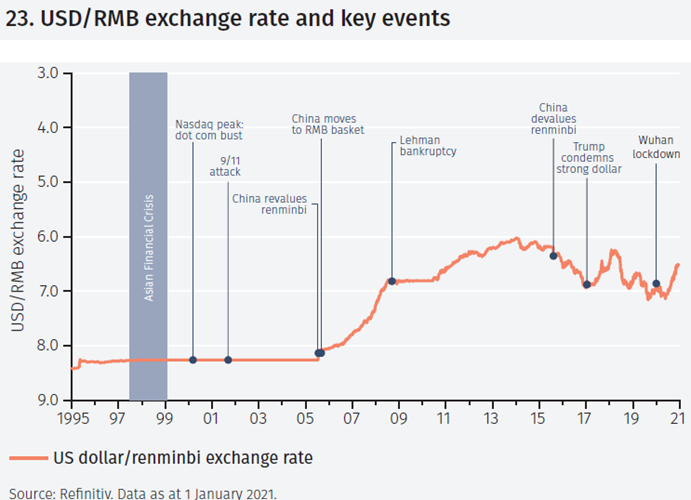
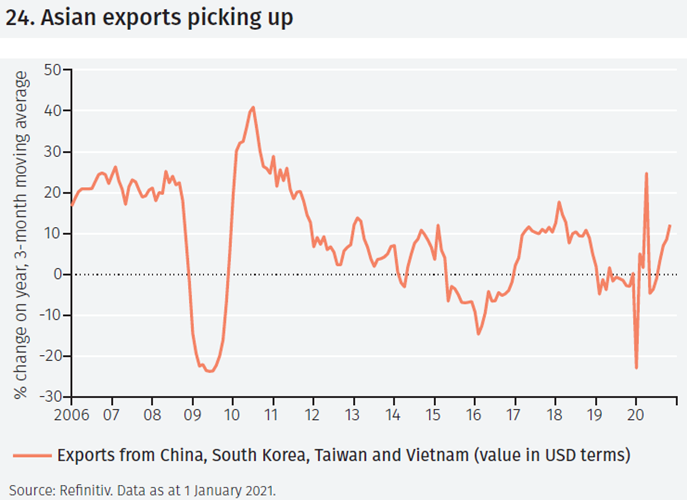
This may reflect the fact that China has recovered well from the Covid-19 pandemic, although the role for market forces in what is still a tightly controlled exchange rate regime must surely be limited. China now looks set to have recorded GDP growth of around 2% in 2020 and the IMF forecasts growth at over 8% in 2021. Across Asia, exports are once again driving growth (see Figure 24). It would be wrong, however, to characterise this simply as cheap Asian exports satisfying western consumer demand. Trade inter-relationships are much more nuanced.
More chips than oil
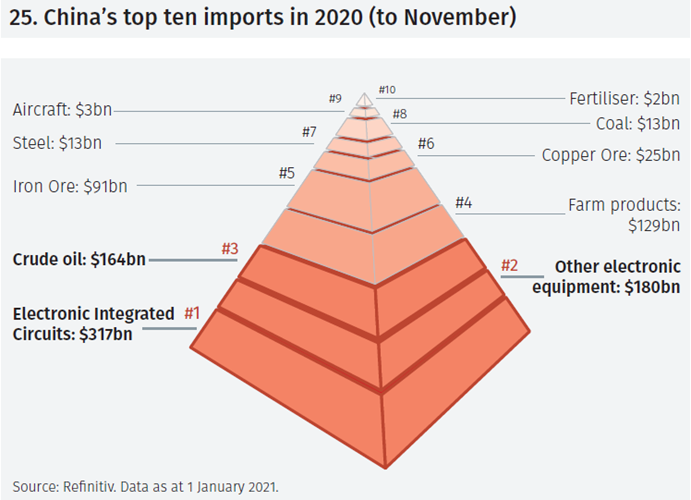
In 2020, electronic integrated circuits were the largest category of China’s imports, well in excess of crude oil (see Figure 25). Many of these electronic imports are part of the Asian supply chain, but also often incorporate US technology. That is also the case for software, especially in mobile devices. Any US restrictions on exports to China that incorporate US technology could clearly have a substantial effect.
Asian growth
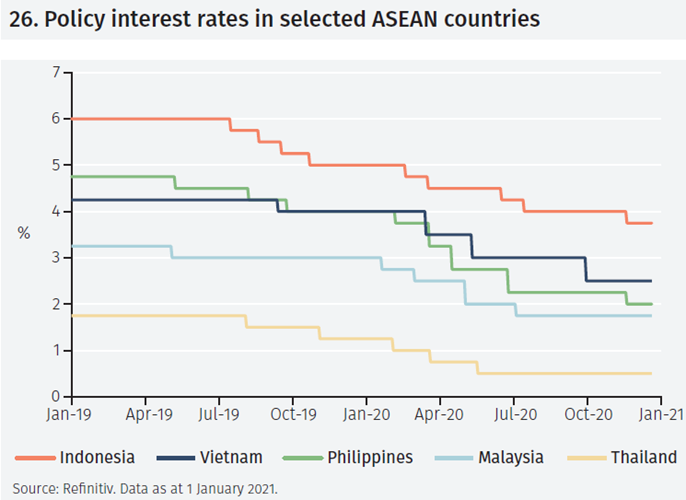
Tourism, important for several countries, was very adversely hit in 2020 but is now recovering. In other economies, growth is more solidly based on domestic demand, which will further benefit from interest rate reductions (see Figure 26). Real GDP growth of 7% or more is expected this year in India, the Philippines, Vietnam, Myanmar and Bangladesh. Asia is set to remain the driver of global growth in 2021.
LATIN AMERICA
Latin America has been hit hard by Covid-19 and the recovery in 2021 is expected to be slow. A high reliance on contact-dependent industries and structural weaknesses are concerns, but the policy response has been substantial.
Covid-19 cases and response
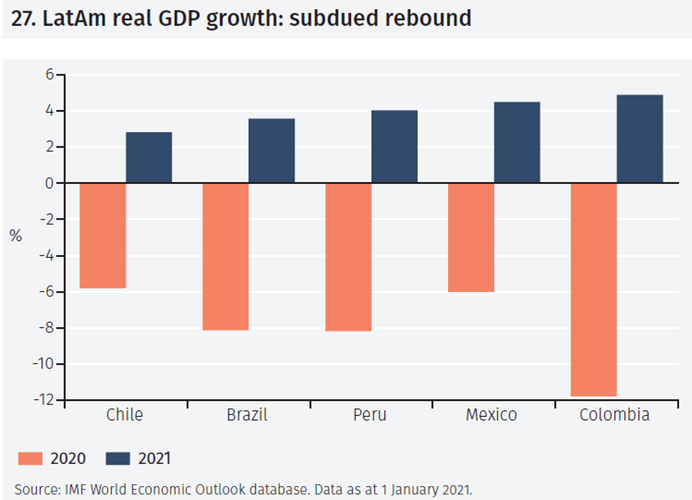
Latin America has been hit harder by the Covid-19 pandemic than other parts of the world. While the region contains only 8% of the global population, it represents around 20% of the infections and 30% of the deaths from the virus.8 The region’s economy is projected to have shrunk by 8% in 2020, almost double the contraction expected worldwide. In 2021, the rebound is expected to be slower than needed to recover from 2020’s setback (see Figure 27).
Three reasons for Latin America’s weakness
There are three main reasons for the severity of the hit to the region’s economy and the expected slow recovery. First, healthcare systems have clearly been overwhelmed in many economies. This reflects historic underinvestment in physical infrastructure and in people. Across the region there are half the number of healthcare professionals relative to the size of population than in high income countries.9
Second, a large proportion of workers (45%, compared to a world average of 30%)10 are employed in contact-dependent industries, such as agriculture, mining and tourism. High skilled and digitally-focused workers have a relatively smaller role than in advanced economies. This raises the prospect of a ‘K-shaped’ recovery, whereby high-skilled, digitally-focused parts of the economy can recover whereas those in contact industries are left behind.
Third, the region has trailed the rest of the world for some time, indicating that fundamental structural weakness also plays a role. Per capita incomes are one quarter of the US level, the same relative size as in the 1990s; Asia has seen rapid growth over the same period (from 5% to 25% of the US level).
Response and recovery
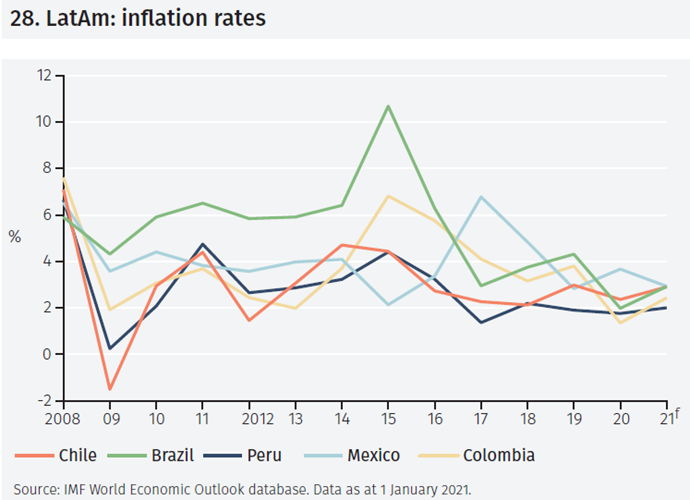
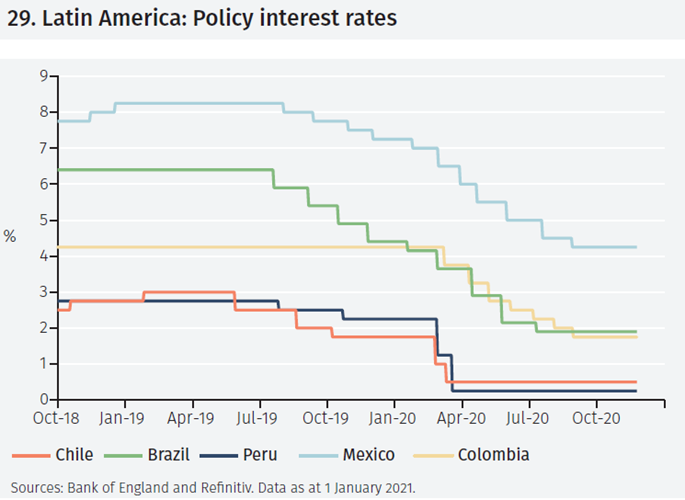
The policy response has, however, been substantial. The direct fiscal response (tax cuts and expenditure increases) has amounted to 4.5% of GDP, with indirect measures taking the total to 8%. Meanwhile, facilitated by low inflation rates (see Figure 28) policy interest rates have been cut substantially (see Figure 29). The four economies which the IMF describes as having ‘platinum quality policies’ - Chile, Colombia, Mexico and Peru – are also able to access IMF emergency credit lines, if required.
Opening up trade within the region and forging closer links with the rest of the world will, however, need to be the key elements of a robust, longer-term recovery.
SPECIAL FOCUS – PANDEMICS AND INFLATION
The effect of the pandemic on inflation looks set to come into sharper focus in 2021. We still see low inflation persisting; but past experience also suggests that workers will benefit.
The pandemic has been both a supply and demand shock. Production for some goods and services has been disrupted or impossible, while demand for many items has evaporated. How might the demand and supply shifts balance out as the pandemic abates and recovery takes place? And, in particular, what will be the effect on inflation?
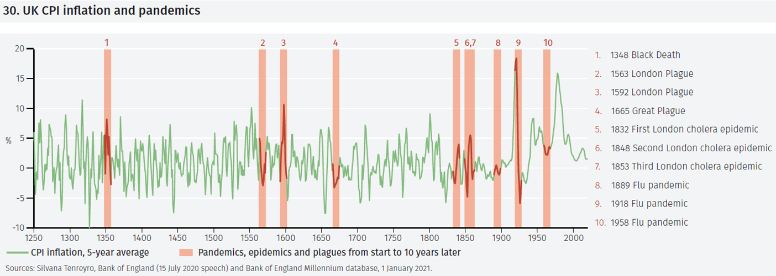
The UK has a long history of consumer price inflation – from the thirteenth century – and ten experiences with pandemics: from the Black Death in the fourteenth century, plagues in the sixteenth and seventeenth centuries; cholera in the industrial revolution; and three episodes of flu, not just after World War 1 but also in 1889 and 1958 (see Figure 30).
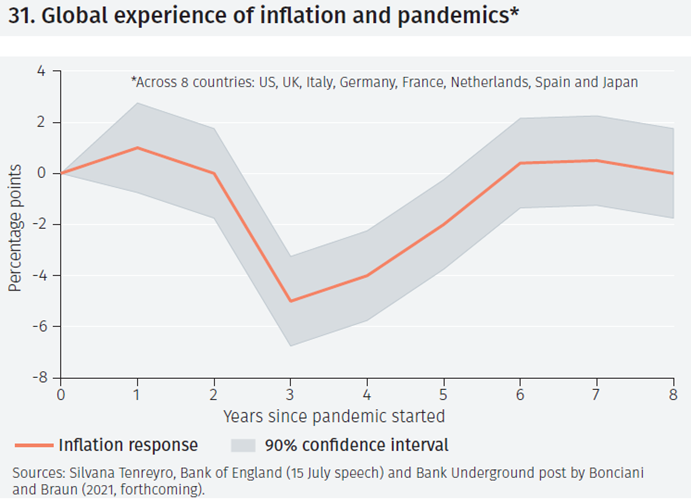
In general, consumer price inflation fell during these periods. The biggest decline was seen 4-5 years after the start of the outbreak, with inflation falling by an average of 4 percentage points. Ten years after the start of the outbreak (the red shaded areas in Figure 30) inflation had broadly returned to its previous rate. The international evidence that is available (see Figure 31) suggests a broadly similar pattern has been seen in other countries.
Workers, however, typically do well, especially as pandemics normally lead to labour shortages. That was particularly the case after the Black Death, when there was a widespread shortage of agricultural workers. The average UK experience is that real wages rise quite strongly (by 7% after 5 years and more than 10% after ten years) as a result of pandemic.
Of course, this historic evidence needs to be treated very carefully. Activist monetary and fiscal policy was not a feature of those previous episodes. International travel was limited. Vaccines were not available. But, in the words of Edmund Burke, “those who do not learn from history are doomed to repeat its mistakes”.
Footnotes
1 The peak in Irish 10-year government bond yields was 13.9% on 18 July 2011. Source: Refinitiv; 1 January 2021.
2 See Thomas Levenson, Money for Nothing, Random House (2020).
3 The Bloomberg Barclays Global Aggregate Bond Index is a benchmark of government and investment grade corporate debt from developed and emerging markets issuers in 24 countries.
4 The Federal Reserve Bank of Atlanta’s 7 January 2021 GDPNow forecast is for 8.9% annualised growth. https://www.frbatlanta.org/cqer/research/gdpnow
5 Source: Oxford Blavatnik Stringency Measure via Refinitiv; 4 January 2021.
6 See ECB Economic Bulletin, Issue 7/2020.
7 From August 2019 to January 2020.
8 Source: IMF Live event with IMF Managing Director Kristalina Georgieva and Council of the Americas CEO Susan Segal; 15 December 2020.
9 Source: Worldometers; 1 January 2021. Doctors, nurses and midwives per 1000 population.
10 Source: IMF Live event (n 8).
Important Information
The value of investments and the income derived from them can fall as well as rise, and past performance is no indicator of future performance. Investment products may be subject to investment risks involving, but not limited to, possible loss of all or part of the principal invested.
This document does not constitute and shall not be construed as a prospectus, advertisement, public offering or placement of, nor a recommendation to buy, sell, hold or solicit, any investment, security, other financial instrument or other product or service. It is not intended to be a final representation of the terms and conditions of any investment, security, other financial instrument or other product or service. This document is for general information only and is not intended as investment advice or any other specific recommendation as to any particular course of action or inaction. The information in this document does not take into account the specific investment objectives, financial situation or particular needs of the recipient. You should seek your own professional advice suitable to your particular circumstances prior to making any investment or if you are in doubt as to the information in this document.
Although information in this document has been obtained from sources believed to be reliable, no member of the EFG group represents or warrants its accuracy, and such information may be incomplete or condensed. Any opinions in this document are subject to change without notice. This document may contain personal opinions which do not necessarily reflect the position of any member of the EFG group. To the fullest extent permissible by law, no member of the EFG group shall be responsible for the consequences of any errors or omissions herein, or reliance upon any opinion or statement contained herein, and each member of the EFG group expressly disclaims any liability, including (without limitation) liability for incidental or consequential damages, arising from the same or resulting from any action or inaction on the part of the recipient in reliance on this document.
The availability of this document in any jurisdiction or country may be contrary to local law or regulation and persons who come into possession of this document should inform themselves of and observe any restrictions. This document may not be reproduced, disclosed or distributed (in whole or in part) to any other person without prior written permission from an authorised member of the EFG group.
This document has been produced by EFG Asset Management (UK) Limited for use by the EFG group and the worldwide subsidiaries and affiliates within the EFG group. EFG Asset Management (UK) Limited is authorised and regulated by the UK Financial Conduct Authority, registered no. 7389746. Registered address: EFG Asset Management (UK) Limited, Leconfield House, Curzon Street, London W1J 5JB, United Kingdom, telephone +44 (0)20 7491 9111.
Please use the button below to download the full article.