- Date:
- Author:
- Joaquin Thul
Infocus - Inflation has surged to levels not seen in decades due to rising commodity prices, supply chain bottlenecks and tight labour markets. These factors apply to most developed countries, but not to Switzerland where inflation remains low. In this edition of Infocus, GianLuigi Mandruzzato compares Swiss inflation to that in the US and the eurozone and draws some policy implications.
Estimates of US company earnings in 2023 have been revised downwards recently, in sympathy with an anticipated reduction in economic activity in the second half of the year. In this edition of Infocus, Economist Joaquin Thul looks into the trend and cycle components of US earnings and provides a scenario analysis for the upcoming quarters.
The start of the US earnings season for Q2 2023 coincided with the recent downgrade of market expectations for full-year 2023 earnings. FactSet consensus data show analysts anticipate US earnings to fall 0.5% year-on-year (YoY) in 2023, before rising by more than 12% YoY in both 2024 and 2025.1 These forecasts have been revised downwards in the last few months.
It is important to understand the reasons behind changes in earnings growth. To do this, we decompose US earnings into trend and cyclical components using the Hodrick-Prescott (HP) filter, a widely used tool in macroeconomics.2 The trend component gives us information about the long-term level of earnings, while the cyclical component informs us about deviations from the trend (see Figure 1).
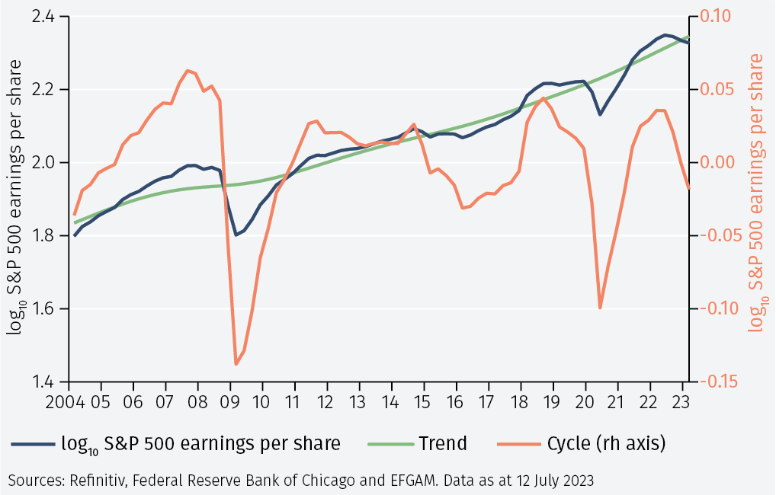
Looking at the cyclical component, we observe that earnings are now below trend, coincident with a slowdown in the US economy. In Figure 1 above, this is reflected by US earnings (orange line) dipping below the historical trend (green line), while the cycle component (blue line) has fallen below zero indicating that earnings are currently below the long-term trend.
Although the US economy is not in recession, many activity indicators are in decline. For example, manufacturing activity, measured by the ISM Manufacturing PMI index, has been in contraction for the past nine consecutive months, with the current level of 46.4 being close to the lows from the Covid pandemic. Similarly, annual growth in industrial production has been slowing since April 2021 and has recently turned negative in the last month with a decline of 0.43% YoY. Alternatively, the Chicago Fed National Activity index (CFNAI),3 which is a monthly measure of US growth constructed from a panel of 85 indicators of economic activity, has been in decline in seven of the past nine months.
The CFNAI aggregates components of the US economy into four groups: production and income; employment; consumption and housing; and sales, orders and inventories, providing a good measure of the economic cycle in the US. In this analysis we focus on the CFNAI given its accuracy tracking past periods of expansion and recession in the US economy.4
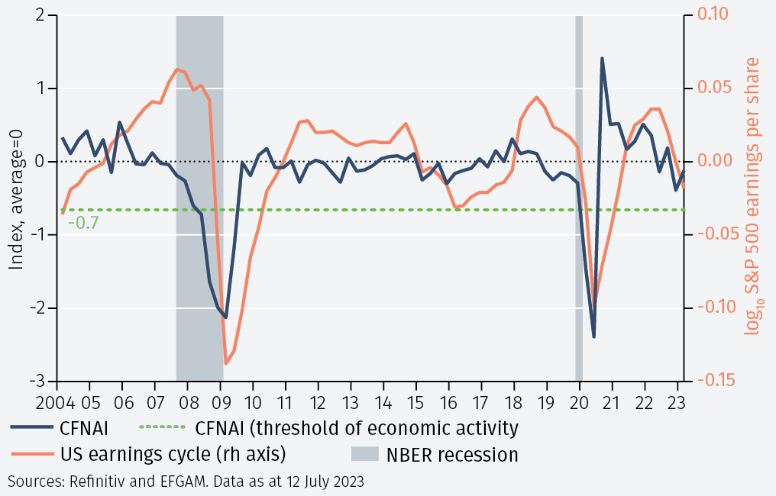
Previous periods of economic contraction in the US have been associated with a value of the CFNAI below -0.7.5 In recent months, the slight pick-up in the employment component has been offset by continuous declines in the components for consumption and housing and sales, orders and inventories. Production-related indicators have been in decline in nine of the last twelve months, being the main driver of the weakness in the composite index.
Therefore, analysing the earning’s cycle component against the CFNAI allows us to observe short-term fluctuations associated with the business cycle (see Figure 2). In the last 20 years there have been three episodes in which the US earnings cyclical component has been negative. In 2008 and 2020 it coincided with economic recessions as defined by the National Bureau of Economic Research (NBER). The third episode, in 2015, occurred during a time of slowing economic activity but did not coincide with a full economic recession.
In the period between Q1 2015 and Q4 2016, US quarterly earnings were down by an average of 4% YoY. This was mostly attributed to the collapse of earnings in the energy sector, which declined by an average of 80% during that period, driven by a sharp fall in the oil price. However, excluding the impact of energy, US earnings were up by over 1.5% YoY during this period, reflecting that the weakness in earnings was specific to the energy sector and not broad-based.
Although current economic conditions reflect a slowdown in activity that has contributed to a decline in earnings growth below trend, the rate of decline is not yet comparable with previous episodes of economic recession, such as 2008 and 2020. While the approach is useful as a means to separate historic differences between the trend and the cycle, the technique uses future values to compute the cyclical component and so tends to overstate its predictive power. Therefore, it is necessary to estimate a different model to forecast future scenarios.
Forecasting model
We estimate a model for US earnings growth based on four independent variables: US GDP growth, US headline inflation, share buyback growth and the Federal funds rate. Assumptions were made about these four variables based on consensus expectations, which currently anticipate a gradual decline in US GDP growth and headline inflation to fall below 3% by Q1 2024. Markets also expect the Fed to keep interest rates unchanged for the remainder of 2023, with consensus expectations currently anticipating the first rate cut for Q1 2024. An assumption was made regarding share buybacks in line with recent trends.
Incorporating these variables, the estimated model projects an improvement in earnings in Q2 and Q3 2023 before a decline in the last quarter of the year as economic activity decelerates further (see Figure 3).
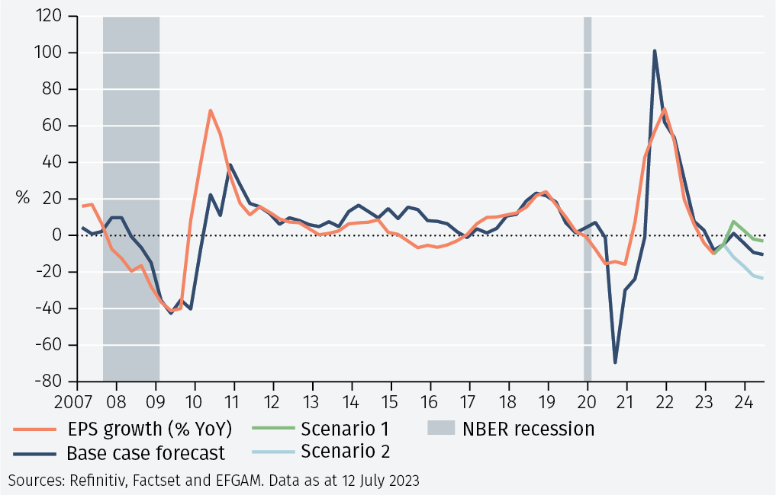
Taking consensus views as our base case, we construct two alternative scenarios based on more optimistic and pessimistic conditions. In Scenario 1 we simulate an improvement in economic conditions based on inflation peaking and a rise in GDP growth in response to interest rate cuts by the Fed. Alternatively, in Scenario 2 we simulate a deterioration in economic conditions, with the Fed forced to keep hiking interest rates as inflation remains persistently high, triggering a more pronounced deceleration in GDP growth.
Although the pick-up in earnings in Scenario 1 would be more pronounced in Q2 2023 and Q3 2023, earnings would still be expected to decline by the end of the year. Alternatively, as expected under the more pessimistic assumptions in Scenario 2, the decline in earnings would be deeper, surpassing the one registered during the 2020 pandemic. However, given the recent data on inflation and expectations that interest rates will peak in the coming month, the probability of economic data unfolding in line with Scenario 2 is relatively small. Conversely, according to the model, GDP growth in the US would have to surprise on the upside, accelerating above 2.5% YoY in the coming quarters for earnings to rebound sharply. This scenario is also unlikely.
It is important to note that the model lagged in 2009, when it was slow to reflect the sharp decline in earnings during the GFC, and underestimated the rebound in earnings in the subsequent quarters. However, for this to happen again during this cycle economic data in the US would need to deteriorate significantly in a short period of time which would likely resemble the assumptions made in Scenario 2.
Conclusion
The use of the HP filter allows us to compute trend and cyclical components of earnings, currently showing earnings growth below trend as the US economy shows signs of weakening. Looking at the forecast model, our base case, which depicts a gradual deceleration in GDP growth and inflation slowly trending lower, shows earnings growth recovering in Q2- and Q3-2023, before turning negative again in Q4-2023. Markets currently anticipate a deceleration of over 20% in earnings for energy for the calendar year 2023, associated with further weakness in commodity prices.6 If, as we expect, the US economy avoids a sharp recession in 2023 then earnings growth could resemble 2015, with a year-on-year decline of 1% over the calendar year and most of this weakness concentrated in commodity-related sectors, rather than the more pronounced double-digit decline registered in 2008. In that case, excluding the energy sector, US earnings would be expected to grow by approximately 10% in 2023, showing that the problems in the economy would be sector-specific and not broad-based.
1 Based on the MSCI USA index. Data as of 19 July 2023.
2 The HP filter is a mathematical tool developed by economists Robert Hodrick and Edward Prescott in the 1990s.
3 The CFNAI is constructed to have an average value of zero and a standard deviation of one. Since economic activity tends toward trend growth rate over time, a positive index reading corresponds to growth above trend and a negative index reading corresponds to growth below trend. See https://www.chicagofed.org/research/data/cfnai/about
4 According to a study from Berge and Jordà (2011), the CFNAI has tracked US expansions and recession with a 95% accuracy.
5 Negative values of the CFNAI indicate below-average economic growth, while positive values indicate above-average economic growth.
6 The weight of the energy sector in the MSCI USA index has halved since 2015 from 8% to 4%.
Important Information
The value of investments and the income derived from them can fall as well as rise, and past performance is no indicator of future performance. Investment products may be subject to investment risks involving, but not limited to, possible loss of all or part of the principal invested.
This document does not constitute and shall not be construed as a prospectus, advertisement, public offering or placement of, nor a recommendation to buy, sell, hold or solicit, any investment, security, other financial instrument or other product or service. It is not intended to be a final representation of the terms and conditions of any investment, security, other financial instrument or other product or service. This document is for general information only and is not intended as investment advice or any other specific recommendation as to any particular course of action or inaction. The information in this document does not take into account the specific investment objectives, financial situation or particular needs of the recipient. You should seek your own professional advice suitable to your particular circumstances prior to making any investment or if you are in doubt as to the information in this document.
Although information in this document has been obtained from sources believed to be reliable, no member of the EFG group represents or warrants its accuracy, and such information may be incomplete or condensed. Any opinions in this document are subject to change without notice. This document may contain personal opinions which do not necessarily reflect the position of any member of the EFG group. To the fullest extent permissible by law, no member of the EFG group shall be responsible for the consequences of any errors or omissions herein, or reliance upon any opinion or statement contained herein, and each member of the EFG group expressly disclaims any liability, including (without limitation) liability for incidental or consequential damages, arising from the same or resulting from any action or inaction on the part of the recipient in reliance on this document.
The availability of this document in any jurisdiction or country may be contrary to local law or regulation and persons who come into possession of this document should inform themselves of and observe any restrictions. This document may not be reproduced, disclosed or distributed (in whole or in part) to any other person without prior written permission from an authorised member of the EFG group.
This document has been produced by EFG Asset Management (UK) Limited for use by the EFG group and the worldwide subsidiaries and affiliates within the EFG group. EFG Asset Management (UK) Limited is authorised and regulated by the UK Financial Conduct Authority, registered no. 7389746. Registered address: EFG Asset Management (UK) Limited, Park House, 116 Park Street, London W1K 6AP, United Kingdom, telephone +44 (0)20 7491 9111.