- Date:
Infocus - The pros and cons of cryptocurrency investment
The Covid-19 pandemic has had enormously contractionary effects on economic activity across the world. In this issue of Infocus, Chief Economist Stefan Gerlach and Senior Economist GianLuigi Mandruzzato investigate these effects more closely.
The Covid-19 pandemic has had immensely negative effects on economic activity across the world. Two factors have played a role. First, to reduce contagion, governments introduced a number of restrictions on non-essential activities, mobility, social interaction and in-person education. Second, the risk of catching the virus has encouraged the public to stay at home and to limit social contact. Both voluntary and government enforced social distancing have led to large declines in the revenues of bars, restaurants and hotels, and also for stores and the travel industry. Both factors have been significant, but what has their relative importance been? This is the key issue addressed below.
Economic activity
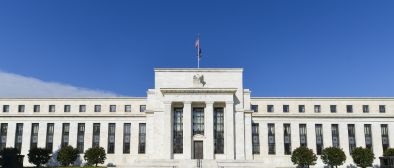
Composite Purchasing Managers’ Indices (PMIs) are measures of economic activity obtained from monthly surveys of thousands of manufacturing and service companies in industrialised and emerging economies.1 Each country’s PMI is structured as a diffusion index corresponding to the percentage of companies reporting an expansion in their activity compared to the previous month. Index values above 50 are taken to signal increases in aggregate economic activity, while values below 50 signal decreases. Over the past two decades, PMI composites have established themselves as arguably one of the most reliable and timely indicators of the business cycle.
The behaviour of PMIs in 2020 and in early 2021 reflects the severity of the shock that hit the world economy. Index levels fell to record lows between April and May in most of the 15 countries in the sample below, coinciding with the first wave of the pandemic. During the summer, composite PMIs recovered rapidly, often rising well above 50. In late 2020 and in January 2021, several European countries and Brazil saw the index fall below 50 (see Figure 1), in some cases by a large margin, although so far index levels have remained above last spring’s lows. In the US and Asia, with the exception of Japan, and Australia index levels have risen further or remained elevated.
The stringency of restrictions
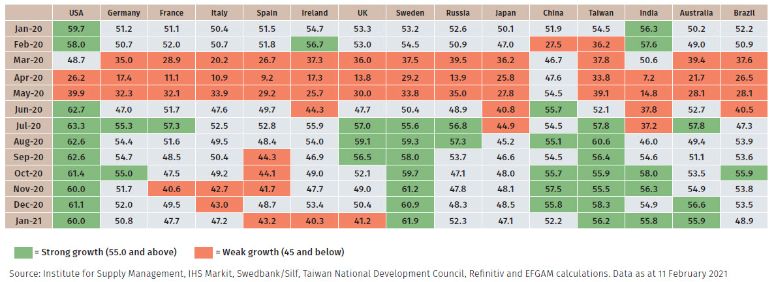
To contain the spread of the virus, almost all governments have imposed restrictions on personal mobility, socialisation, and economic activities. Government responses have varied across countries in terms of timing of implementation and of intensity of the measures adopted. A concise and comparable measure of government response to Covid is the Government Stringency Index developed by the Blavatnik School of Government at Oxford University.
Chinese and Indian authorities have adopted very restrictive measures since the beginning of the pandemic. This corresponds to a Stringency Index that rises rapidly to high levels at the start of the pandemic and remains elevated, even accounting for some recent relaxation in India (see Figure 2). Conversely, containment measures in Taiwan were less stringent, but have so far proved effective in keeping mortality low.
In most European countries, very restrictive measures on personal mobility were initially adopted and economic activity was limited to essential sectors such as healthcare, food and finance. Lower and higher education was conducted remotely. As contagion declined, restrictions were gradually eased during the summer. However, containment measures were tightened again as the autumn and winter progressed, often to a degree close to the start of the pandemic. A partial exception to this pattern is Sweden, where the government initially preferred to merely make recommendations rather than imposing restrictions on personal freedoms; more recently, however, Sweden was also forced to adopt more stringent limitations on socialising.
In the United States, the response has been scattered, and often left to local authorities given former President Trump’s scepticism about the severity of the crisis and the need to take action. Except for the federal recommendation to stay at home issued in mid-March, local authorities were left deciding which measures to adopt to contain infections and hospitalisations, often resulting in a reactive rather than pre-emptive approach. That is expected to change under the Biden administration, but this is not yet evident in the data.
Mortality
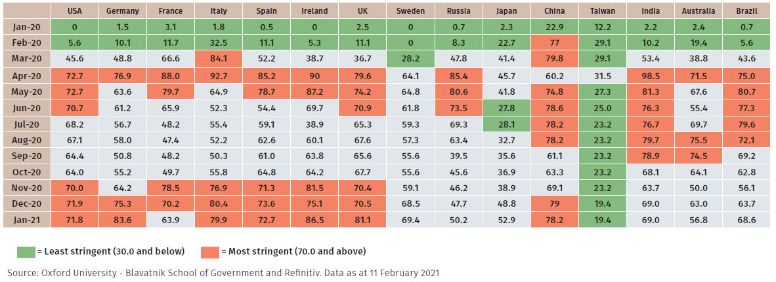
Several statistics have been used to gauge the severity of the pandemic. The mortality rate per million inhabitants (see Figure 3) is less affected by statistical or other policy-related biases than other statistics such as the number of cases or hospitalisations.2 It therefore allows for a more accurate comparison of the severity of the pandemic across countries than other measures such as recorded cases. It is therefore used here.
Looking at mortality rates, it is striking that they are much higher in Europe, including Russia, the US and Brazil, than in Asia.
The time pattern of mortality rates reflects the impact of the pandemic waves. During the first wave, the peak in highmortality countries was reached in April, the second month after the start of the pandemic, except for Brazil where the virus arrived in July, in the middle of the southern hemisphere winter. After a decline in the summer months in the northern hemisphere, the arrival of colder seasons coincided with a new, sharp increase in mortality rates which in several countries unfortunately surpassed the peaks of the first wave. This trend was also driven by the spread of new, more infectious variants of the virus.
In countries with low mortality rates, the trend has so far been without significant peaks, although Japan recorded its highest rate in January, supporting the view that the severity of the pandemic is related to falling temperatures.
Severity of restriction, mortality and the PMIs
Next, a statistical model is used to explain the percentage change in the PMI in the 15 countries studied above, using the change in the severity of restrictions and the change in mortality during the present and the previous months. Since the model is dynamic, the impact of changes in stringency of restrictions and mortality can be computed for the impact month (Month 0) and the following month (Month 1).
The results for the full sample, March 2020 to January 2021, are presented in Figure 4, where the blue blocks represent the impact in Month 0 and the orange blocks Month 1. Consider first the left-hand panel with the “unadjusted” data. This shows that a one standard deviation increase in stringency reduces the PMI by almost 10% (that is, from 50 to 45) immediately and by 20% (from 50 to 40) in the month after.3 By contrast, a one standard deviation increase in the intensity of the pandemic as measure by mortality leads only to about a 4% decline in the PMIs after two months (that is, from 50 to 48).
However, the only reason governments introduce restrictions and increase the degree of stringency is that there is a pandemic raging. It is therefore sensible to decompose changes in stringency into the part related to changes in mortality, and the part that is unrelated to mortality (for instance, stringency may vary among countries because of differences in the perceived effectiveness of restrictions, or because governments react to expected future changes in the intensity of the pandemic).
The results following this adjustment are shown in the right-hand panel of Figure 4. Since some of the changes in stringency are now attributed to mortality, the overall impact of a one standard deviation increase in stringency is now to lower the PMI by about 12% after two months. The impact of mortality has of course risen, to about 11%.
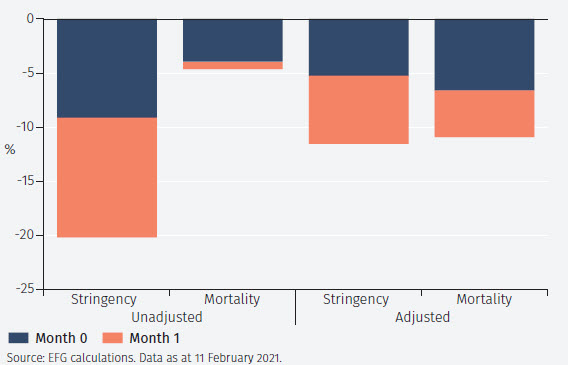
Overall, the results above suggest that stringency of restrictions and mortality have been broadly equally important in accounting for changes in the PMIs.
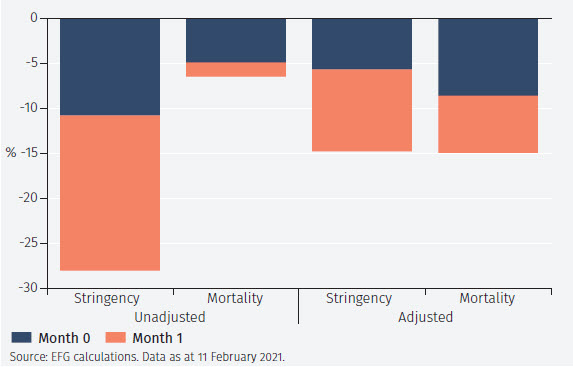
But the relative importance of the stringency of restrictions and mortality as a measure of the intensity of the pandemic might have changed during the course of the pandemic. It is therefore of interest to perform the analysis separately for the first and second waves of the pandemic.
Figure 5 below shows the results for the first wave. These look much like those for the full sample, except that a one standard deviation increase in the stringency of the restrictions and in mortality has a somewhat greater contractionary impact on the PMIs.
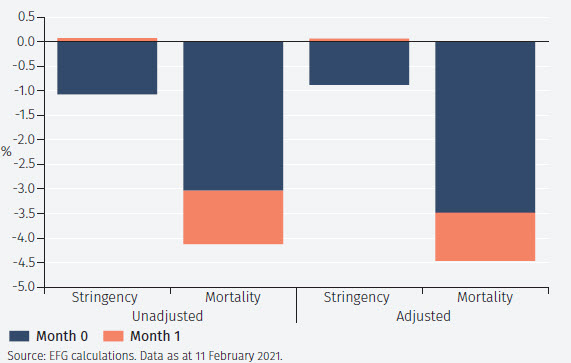
Turning to the second wave in Figure 6, it is immediately apparent how much smaller is the impact of both stringency and mortality on the PMIs. Furthermore, it is clear that increases in the intensity of the pandemic as measured by mortality were more important for the downturn in economic activity than increases in the degree of stringency of the containment measures.
A simulation
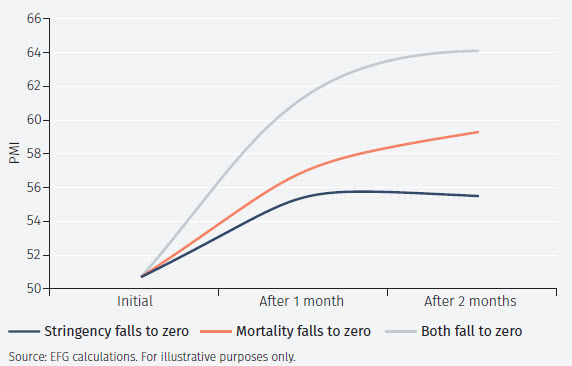
It is interesting to ask how the PMIs would respond if suddenly the pandemic stopped. During the pandemic, growth fell below trend as evidenced by the PMIs falling below 50. Growth has since recovered and the average PMI in the countries studied was 50.7 in January. For the economies to return towards the pre-Covid growth path, growth needs to rise above trend for some period of time, that is, the PMIs must exceed 50.
How far might they rise? Figure 7 provides some answers using the model above. Assuming that all restrictions were lifted (and mortality did not rise, which seems a very unlikely combination of events), the model predicts that the average PMI would rise to 56 before starting to return gradually towards 50, as shown in the blue line on the chart. Assuming instead that mortality fell to zero and voluntary social distancing stopped (even though the restrictions are assumed not to change, also an unlikely event), the average PMI is forecast to rise to 57 after one month and 59 after two months, and then start to decline gradually towards 50, as shown in the orange line.
Finally, consider the case in which all restrictions were removed and mortality fell to zero in a month. If so, the model forecasts a rise in the PMIs to 63 after a month and 64 after two months, before they gradually start to revert to 50. This projection, which is subject to very considerable uncertainty, most likely overestimates the rise in the average PMIs since the pandemic is likely to slow gradually. However, it supports the view that ending the pandemic will trigger a rise, and perhaps even a surge, in the PMIs. Moreover, the exercise allows us to gauge the likely PMI response dependent on the speed with which restrictions are lifted and with which mortality declines, for example in response to vaccination programs.
Conclusions
There are four main findings of the statistical analysis.
First, the restrictions were introduced and tightened because of the intensity of the pandemic, measured by the mortality rate. In assessing the relative importance of the two factors in triggering fluctuations in the PMI it is therefore important to distinguish between the direct impact of mortality on PMIs (due to voluntary changes in behaviour) and the indirect impact of mortality on PMIs (due to the associated tightening of stringency conditions).
Second, both increases in the stringency of government responses and in the intensity of the pandemic as captured by mortality reduced the PMIs. This is unsurprising: when stores, hotels, restaurants and bars close, consumers are unable to travel and to buy goods and services in person, this leads to an economic contraction. Similarly, when the likelihood of catching the virus rises, the public grows hesitant about going to stores etc, and this reduces economic activity.
Third, the impact of stringency and mortality appear to be broadly of equal importance. Since most of the fluctuations in the PMIs, stringency and mortality occurred in the first part of the sample, the results for this period dominate the full sample results. That said, in the second period, mortality was much more important than stringency in accounting for changes in economic activity.
Fourth, ending the pandemic is likely to lead to pronounced increases in the PMIs. Exactly how large that rise will be will depend on how quickly the pandemic subsides.
Footnotes
1 IHS Markit publishes the composite PMI for 12 countries: Australia, Brazil, China, France, Germany, India, Ireland, Italy, Japan, Russia, Spain, United Kingdom. The composite PMI for Sweden, Taiwan and the United States of America is calculated by EFGAM applying the IHS Markit methodology to data from Swedbank/Silf, Taiwan National Development Council and US Institute of Supply Management respectively.
2 The absolute number of registered cases depends on the number of tests available (if a positive test is used as the diagnostic criterion), which has been increasing since the start of the pandemic; the number of hospitalisations depends on the availability of beds and the protocols for hospitalisation that may differ among countries.
3 We use the median across countries of the standard deviation of changes in stringency of restrictions.
Important Information
The value of investments and the income derived from them can fall as well as rise, and past performance is no indicator of future performance. Investment products may be subject to investment risks involving, but not limited to, possible loss of all or part of the principal invested.
This document does not constitute and shall not be construed as a prospectus, advertisement, public offering or placement of, nor a recommendation to buy, sell, hold or solicit, any investment, security, other financial instrument or other product or service. It is not intended to be a final representation of the terms and conditions of any investment, security, other financial instrument or other product or service. This document is for general information only and is not intended as investment advice or any other specific recommendation as to any particular course of action or inaction. The information in this document does not take into account the specific investment objectives, financial situation or particular needs of the recipient. You should seek your own professional advice suitable to your particular circumstances prior to making any investment or if you are in doubt as to the information in this document.
Although information in this document has been obtained from sources believed to be reliable, no member of the EFG group represents or warrants its accuracy, and such information may be incomplete or condensed. Any opinions in this document are subject to change without notice. This document may contain personal opinions which do not necessarily reflect the position of any member of the EFG group. To the fullest extent permissible by law, no member of the EFG group shall be responsible for the consequences of any errors or omissions herein, or reliance upon any opinion or statement contained herein, and each member of the EFG group expressly disclaims any liability, including (without limitation) liability for incidental or consequential damages, arising from the same or resulting from any action or inaction on the part of the recipient in reliance on this document.
The availability of this document in any jurisdiction or country may be contrary to local law or regulation and persons who come into possession of this document should inform themselves of and observe any restrictions. This document may not be reproduced, disclosed or distributed (in whole or in part) to any other person without prior written permission from an authorised member of the EFG group.
This document has been produced by EFG Asset Management (UK) Limited for use by the EFG group and the worldwide subsidiaries and affiliates within the EFG group. EFG Asset Management (UK) Limited is authorised and regulated by the UK Financial Conduct Authority, registered no. 7389746. Registered address: EFG Asset Management (UK) Limited, Leconfield House, Curzon Street, London W1J 5JB, United Kingdom, telephone +44 (0)20 7491 9111.