- Date:
Insight Q3 2020
OVERVIEW
The 2020 global recession will be severe but the policy response has been quick and substantial. What can we expect next in economies, policies and politics?
A unique global recession
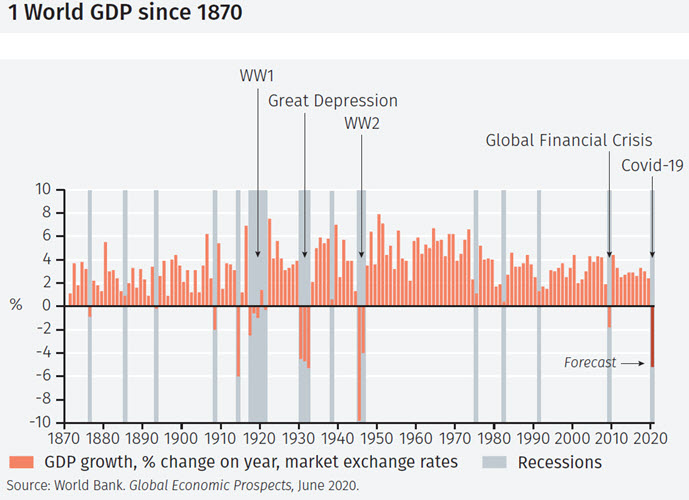
Global GDP is expected to contract by around 5% in 2020 – making it the biggest recession since the end of World War 2.1 Moreover, it is unique in that no other global recession over the last 150 years has been caused by a pandemic. At the risk of overuse of the term, there is no doubt that we are in an ‘unprecedented period’.
Recessions are often triggered by a financial crisis (the most recent being the Global Financial Crisis of 2009), typically following excessive expansion of money and credit and an asset price boom. But there have been other triggers: the two oil shocks of the 1970s and the early 1980s sharp tightening of US monetary policy to curb inflation. Looking further back, the short recessions of the late nineteenth century had their origins in the agricultural sector. In 1876, a plague of locusts devastated crops in the newly-expanded Midwest of America, for example.
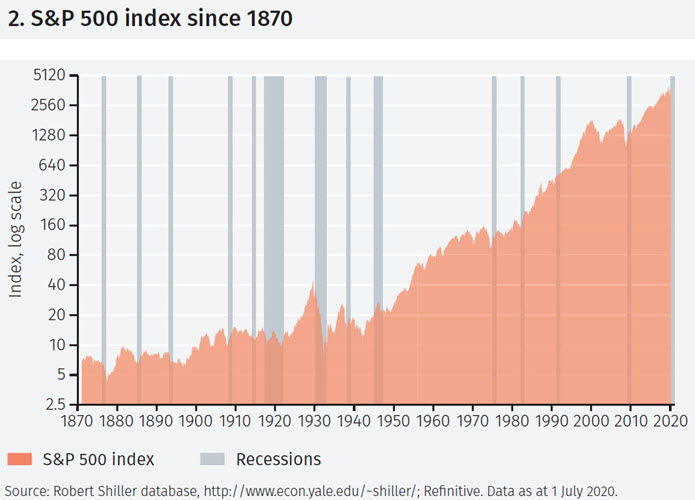
In the current recession, many have expressed surprise at the chasm which has opened up between the behaviour of the stock market and the real economy.2 The MSCI index of world equities, having dropped by almost one third between the start of the year and 23 March, recouped most of the losses by 1 July. The US Nasdaq, with a high representation of technology companies, has reached new highs. Recent price movements appear as a blip on the long-term upward trend in the US S&P 500 index (see Figure 2).
Stock market: too complacent?
Does this mean the equity market is too complacent in the face of the economic damage caused by Covid-19? There are three reasons for thinking that the market behaviour is reasonable. The first is the massive scale of the policy response to the crisis (see Figure 3).
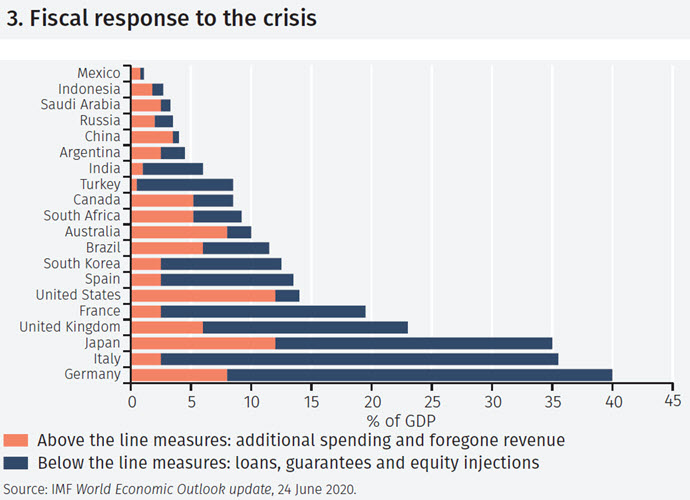
Globally, the reaction of fiscal policy is now estimated at around US$11 trillion.3 One half of these measures (US$5.5 trillion) is additional spending and forgone revenue, directly affecting government budgets. The remaining half ($5.5 trillion) is comprised of various loans, guarantees and equity injections which could add to government debt and deficits in the future if they incur losses. The response has been larger in advanced than in emerging economies. The current fiscal response is around twice the size of that to the 2008/9 Global Financial Crisis. The monetary response saw initial, swift reduction in policy interest rates in the advanced economies followed by substantial asset purchases (see Figure 4).
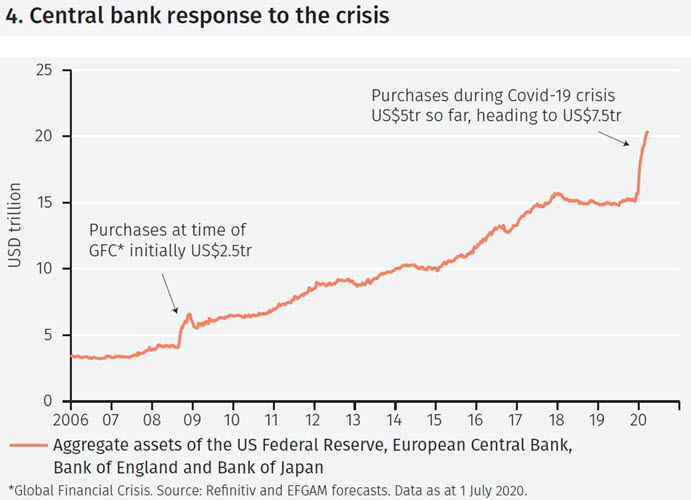
Purchases by the major four central banks have already amounted to twice the size of purchases in the GFC and are likely to be at least three times larger. They are planned to continue through 2020 and are set to reach US$7.5tr or more by the end of the year.
Second, the very low level of interest rates and bond yields enhances the attractiveness of equities, both from an income-generating and potential growth perspective.
Third, the potentially rapid change to working and business practices as a result of the Covid-19 crisis can be captured by exposure to certain areas of the equity market. Lenin’s comment “There are decades where nothing happens, and there are weeks where decades happen” is applicable in this respect. The emergency arrangements put in place to cope with the crisis could just be temporary. But we think they are set to trigger more fundamental longer-term changes in the way businesses operate, how consumers shop, the nature of business and leisure travel and the means of communication.
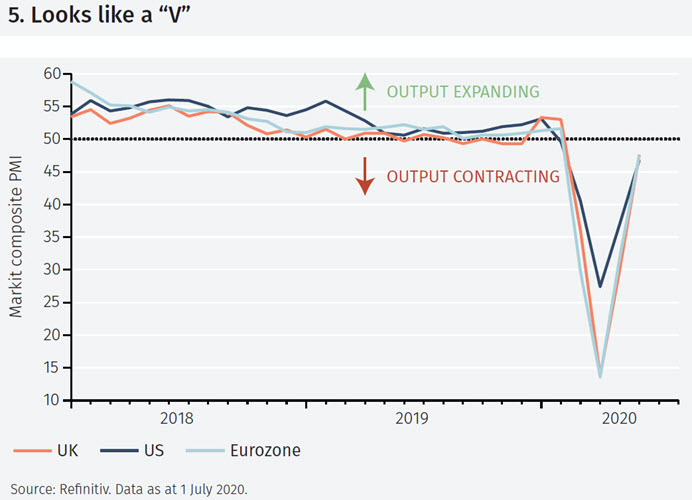
In this sense, a return to pre-Covid-19 ways is most unlikely. That means that although there has been some excitement about the possibility of a V-shaped recovery (shown by some indicators – see Figure 5) this seems unlikely to characterise all sectors of the economy. Different areas will be affected in very different ways. On balance, we think the recovery is still more likely to be a U- or swoosh-shape with, respectively, the recovery taking longer to start or slowing down as it progresses.
On the downside, some companies will clearly be fatally damaged. Others will emerge from the crisis in a very different form. There will be notable winners and losers, a trend already reflected in the sectoral performance of global equity markets. At its broadest, technological, virtual communication and ecommerce-based sectors look set to gain as in-person, physical and high street offerings suffer; but the picture will be more nuanced than that.
Next moves: focus turns to US politics
How these changes affect national and global politics will be a key issue in the second half of the year. In the US, attention will turn to the 3 November presidential election. Often, the outcome of such elections can be discerned by looking at the behaviour of key economic indicators (employment and income growth, whether there has been a recession and so on). But such standard analysis may be less fruitful in the post-pandemic world.
Of course, there will be many polls, but these can be unreliable indicators. For example, in June 1988 George H W Bush trailed the Democratic candidate by 12 percentage points but went on to win by eight. In 2016, even polls on the day of the election suggested Hilary Clinton would win. Voting in key swing states will be crucial to the outcome, and trends in those suggest it will be very close.
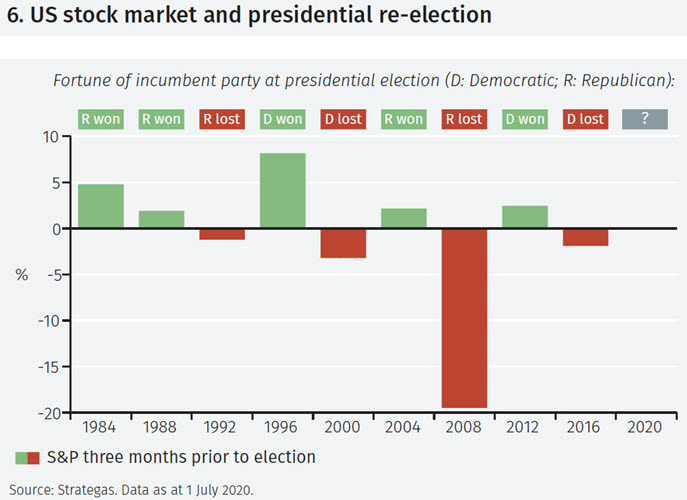
For those who may tire of the complexities of such political analysis, the behaviour of the stock market (see Figure 6) has been a perfect predictor of election outcomes since 1984: a rise in the three months before the election has seen the incumbent party win; a fall has seen it lose. In that sense, President Trump will be hoping for the stock market rise to continue until 3 November.
ASSET MARKET PERFORMANCE
In the second quarter of 2020, equity markets recovered from the losses of the first quarter. US 10-year bond returns were 14%. The weakness of the Australian, Canadian and New Zealand dollars, as well as sterling, was a key feature.
Asset market performance
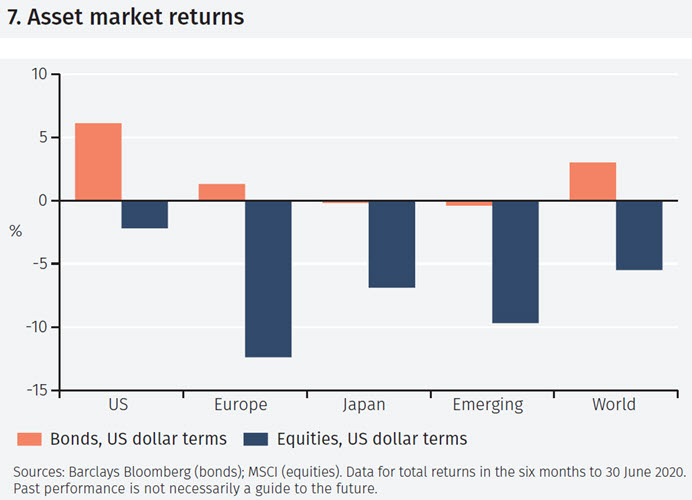
World equity markets saw losses of 5.5% in the first half of 2020 (see Figure 7) on the basis of the MSCI World Index in US dollar terms. However, the first half was one of two distinct quarters: a sharp recovery in the second quarter of the year after losses in the first quarter. Indeed, the second quarter gain for world equities was the strongest since the second quarter of 2009. Both periods saw strong policy support for economies at a time of great uncertainty.
Global bond market returns were 3.0% in the first half of the year on the basis of the Bloomberg Barclays Global Aggregate Index.4 Returns from US bonds (measured by the Bloomberg Barclays US Aggregate Index) were 6.1% and emerging market bonds, after a recovery from a weak first quarter, produced modestly negative total returns for the first half of the year.
Bond markets
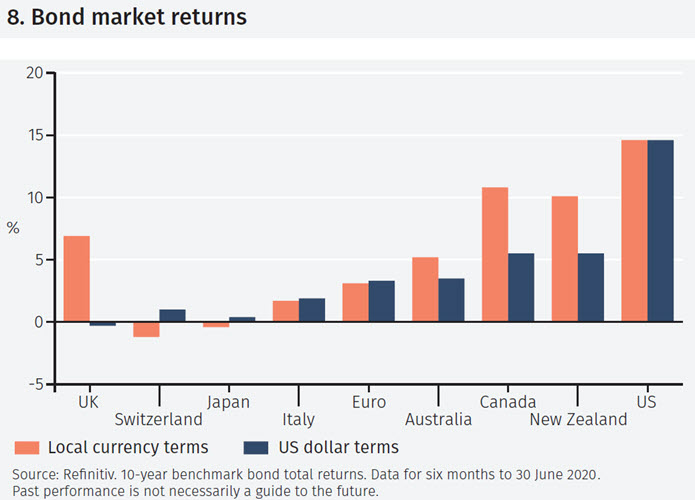
With the decline in yields across bond maturities, longer maturity bonds generally produced higher total returns. The total return from US 10-year government bonds was 14.6% in the first half of the year (see Figure 8), for example. Local currency returns across eurozone government 10-year maturity bonds were lower than that but received a modest boost in US dollar terms by the euro’s appreciation. Within the eurozone, the total returns were highest for German and French government bonds, although the European Central Bank’s bond purchases were tilted towards buying more Italian and Spanish bonds towards the end of the period.
Australian, Canadian and New Zealand 10-year government bond yields fell below 1%; and UK 10-year gilt yields dropped to just 0.2% by the end of the period. Consequently, there were strong local currency returns from these markets. In all cases, however, this was undermined in US$-terms by currency depreciation.
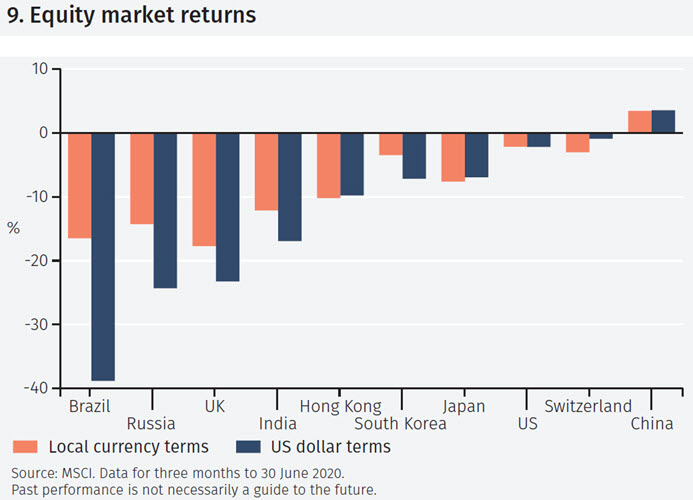
Equity markets
The US equity market (see Figure 9) lost around 2% in total return terms during the first half of the year, with a sharp rebound in the second quarter offsetting most of the first quarter losses. In China, the second quarter rebound was even stronger, leading to marginally positive total returns for the first half of the year. The recovery in the UK market was more muted and was further undermined by sterling weakness, resulting in losses of 23% in US dollar terms for the first half of the year. Brazil, reflecting the damaging effects of the Covid-19 crisis there, saw losses of 39% in US dollar terms.
UNITED STATES
The combined easing of fiscal and financial conditions is set to far exceed that in previous crises: the 1970s oil shock, the ‘dot com’ bust and the subprime/global financial crisis. Will it work?
Fiscal and financial easing
The US response to the Covid-19 crisis has seen combined fiscal and financial easing on a scale not registered before (see Figure 10).
On the basis of the IMF’s latest forecasts, the government deficit will reach 24% of GDP in 2020, a four-fold increase on 2019. That rise is comparable to that seen in World War 2 (it reached 27% of GDP in 1943, having been close to balance before the war). Expressed slightly differently, it is a nearly six standard deviation increase in the budget deficit. Expressing the fiscal easing in that way allows us to compare it with the Federal Reserve Bank of Chicago’s Financial Conditions Index (which is also shown as the number of standard deviations away from average). This measure, produced weekly since 1971, assesses conditions in money markets, debt and equity markets and the traditional and ‘shadow’ banking systems. It has eased substantially since late March 2020, especially as the Fed’s actions have led to an easing (from distressed conditions) across a range of financial markets.
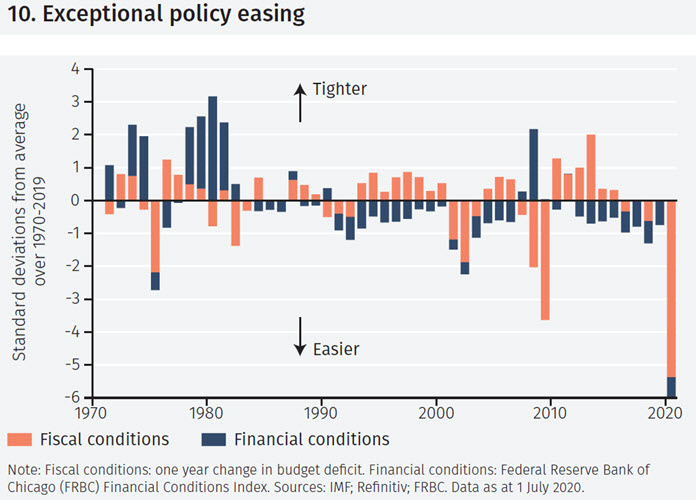
The easing of fiscal and financial conditions in 2020, will, on this combined measure exceed by a considerable margin that during the early 1970s oil shock, the bursting of the dot com bubble in 2001/2 and the sub-prime/global financial crisis.
Will it work?
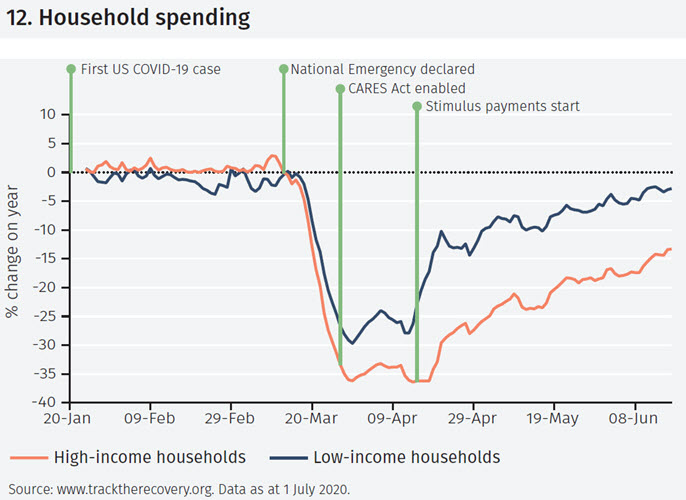
The swift introduction of fiscal support measures has had a direct impact on disposable incomes. In aggregate, these rose sharply in May (see Figure 11). But consumers have responded in different ways (see Figure 12).
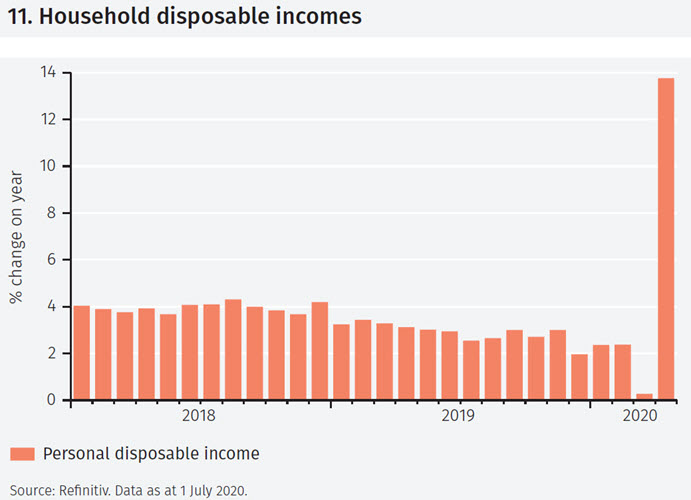
The highest quartile of earners have cut spending by as much as 13%. This cut has been concentrated in in-person services, such as restaurant meals, leisure and entertainment. Employees in these industries, often lowly paid, have suffered but their spending has held up, particularly after stimulus payments started on 15 April.
A more sustainable trend in spending will rely on a broader resumption of economic activity, a task made more complex by the changing nature of the economy. The Nasdaq index, with a large representation of the technology companies expected to benefit from the move to a new pattern of economic activity, sends an optimistic signal about that transition. Its market capitalisation now exceeds that of all the non-US equity markets in the world.6
UNITED KINGDOM
Three problems continue to overshadow the UK: the current Covid-19 crisis; a potential problem with echoes of the past – excess money and credit growth; and finding a Brexit solution.
Coronavirus crisis
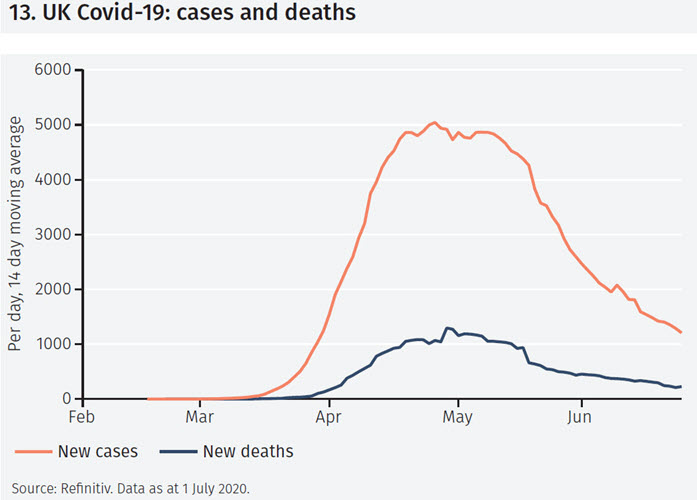
It cannot be said that the UK has handled the coronavirus crisis well. Unfortunately, it now has, after Belgium, the highest death rate (per million population) from the virus. The policy response has often lacked clarity and cohesion. To be sure, the UK is more vulnerable than many economies as a result of its high degree of interconnectedness with the rest of the world. London is still one of the world’s leading financial centres and the country plays an important role in global education, research and technology. As a result, the UK is expected to register a large GDP contraction in 2020 (10.2% in the IMF’s latest forecast, for example). The equity market has lagged other developed equity markets and sterling has weakened since the start of the year. Now that the number of Covid-19 cases and deaths are declining (see Figure 13), the key issue is whether this weakness continues. A key concern is whether the UK experiences a second wave as the economy reopens.
Credit and money growth
One of the longer-term problems of the UK economy is periodic excess money and credit growth. Largely as a result of the policy measures taken to tackle the pandemic, these have started to rise again (see Figure 14). Certainly, the rates of growth are not as rapid as those in the 1970s, which were followed by much higher inflation. However, some fear that higher inflation is just a matter of time, given the stronger money growth and other structural changes.
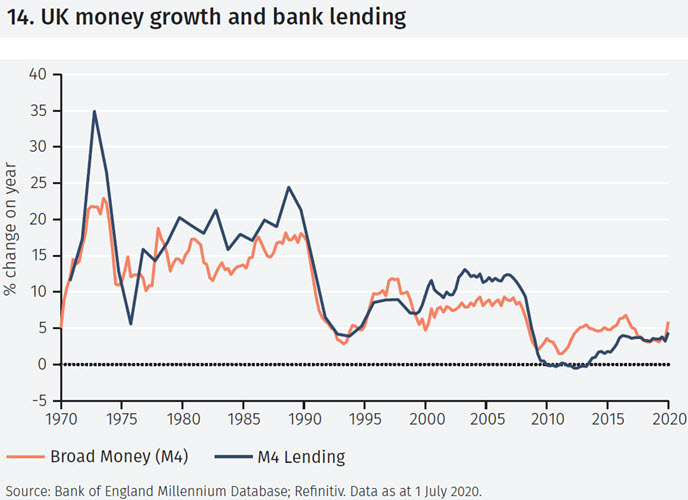
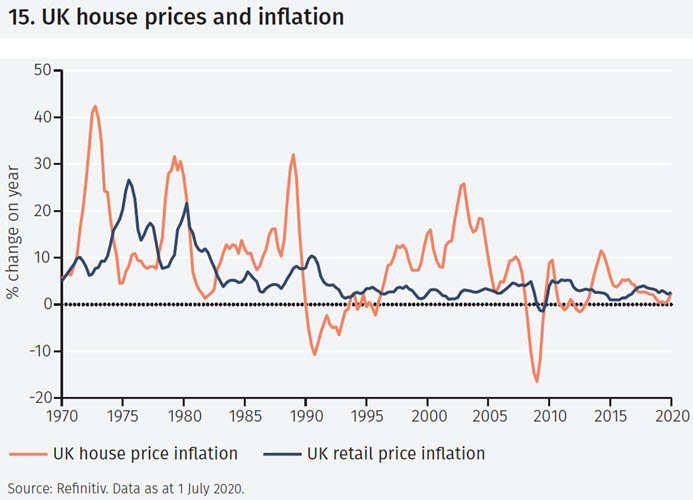
We think that concern is exaggerated. Indeed, more likely, UK inflation will remain subdued. Faster money growth in the past has been driven by stronger credit growth, which in turn has often been a result of liberalisation in the financial system. In current circumstances faster credit growth largely reflects government schemes to provide preferential lending to businesses to help them through the Covid-19 difficulties. These loans are unlikely to be repaid in full. In that sense, the credit growth is somewhat illusory. The stronger credit growth is unlikely to feed through to a boom in the housing market and house prices. In turn, as house price inflation has led more general UK inflation in the past (see Figure 15), we think inflation will remain subdued.
Post-Brexit strategy
As the UK has not asked for an extension to its Brexit transition period (the deadline was 1 July), the UK will leave the EU at the end of the year whether a deal is in place or not. The likely flexibility of the UK government and the EU’s history of finding last-minute compromises indicates to us that there will be a negotiated resolution before year end. That does not mean a full agreement will be in place. More likely, the broad outline will be agreed with the details negotiated in the months and years ahead. Sterling still appears undervalued to us, but until the prospects for the economy and Brexit are clearer few will be willing to enthusiastically embrace the currency and UK assets.
EUROZONE
In the second half of 2020, progress with easing lockdown restrictions across the eurozone will be the centre of attention. The focus will shift to further support measures, such as the European Recovery Fund.
Lockdown impact on GDP
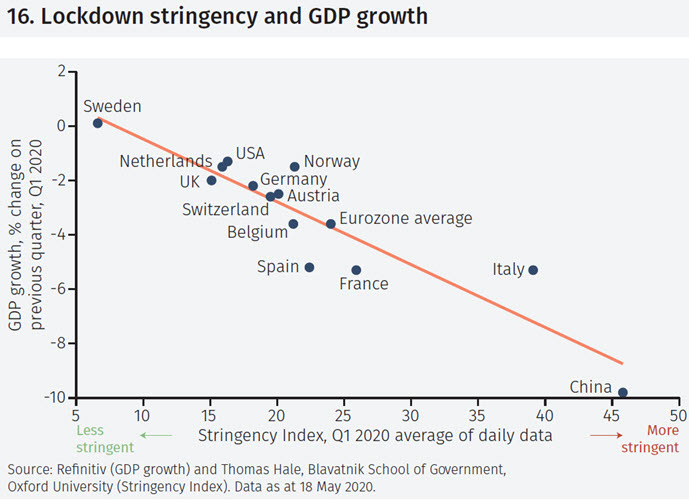
Across the eurozone, lockdowns have eased in many countries and there is some evidence of a bounce-back in activity. However, the latest data on GDP growth relate to the first quarter of 2020, much of it before lockdowns began. In that quarter, there was a reasonably close relationship between the stringency of lockdown in economies and GDP growth (see Figure 16). Across the eurozone, GDP declined by 3.5% and the average stringency measure (on a scale of 0 to 100, with higher measures indicating greater stringency) was 24. Sweden (not in the eurozone) was less stringent and actually registered modest GDP growth; Italy’s measures were the most stringent and its GDP decline amounted to 5.3%.
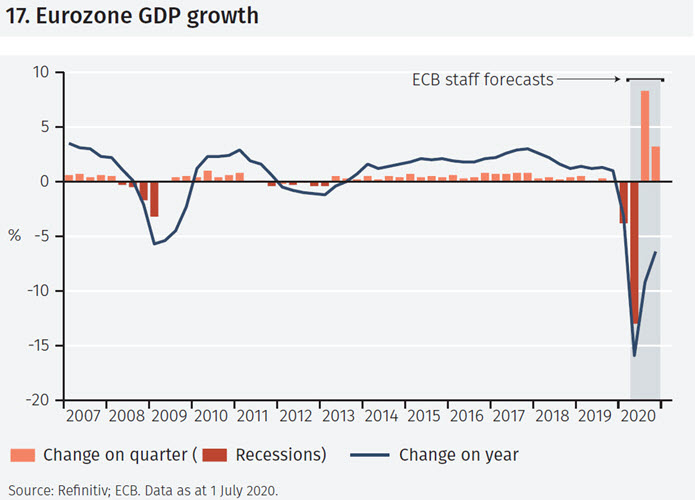
Largely because lockdown measures were in force for almost all the second quarter, the average stringency measure for the eurozone was almost three times higher then. GDP will contract sharply in that quarter (data will be available at the end of July). The European Central Bank’s staff forecasts, growthshown in Figure 17, are for GDP to fall by 13%, followed by a sharp rebound. Of course, this is subject to great uncertainty.
Policy response
As in other advanced economies, the policy response has been substantial. The European Recovery Fund, announced in May, amounts to €750bn and will provide grants and loans across the eurozone. Its launch was hailed by some as Europe’s “Hamilton moment”: the advent of a long-awaited central fiscal policy.7 Yet the fund has not yet been agreed, is unlikely to disburse any funds until 2021 and is not intended to assume the outstanding debts of member states.
Individual countries have their own fiscal initiatives. Some of these are large. The IMF estimates that ‘above the line’ measures – additional spending and foregone revenues – amount to 8% of GDP in Germany and 2.5% in France, Italy and Spain. ‘Below the line measures’ – loans, guarantees and equity injections – are even larger, averaging 25% of GDP across those four economies. We expect that the ‘above the line’ measures will have a more powerful effect on providing support to the economy. The extent to which ‘below the line’ measures are used and effective is, at this stage, uncertain.
ECB bond purchases
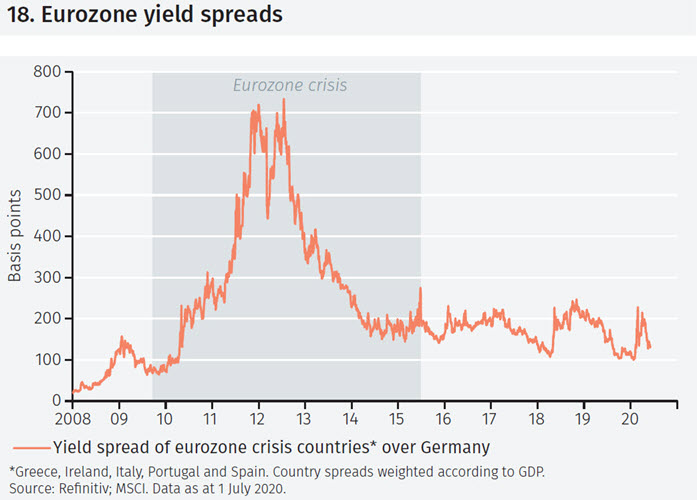
One policy response which has immediately had a clear effect, however, is the change in the pattern of the ECB’s bond purchases. The limit on the proportion of a sovereign’s bonds which can be purchased under its asset purchase scheme has been eased. This has had the effect of reversing the early-2020 widening of the (particularly Italian) yield spread with Germany (see Figure 18). This spread is, perhaps, the key indicator of the credibility of eurozone policy. And it is one which can be observed in real time.
SWITZERLAND
In thinking about the recent strength of the Swiss franc, it is useful to start from a longer term perspective. This shows that the currency remains moderately overvalued in real terms and seems likely to decline gently.
Swiss franc trend since 1913
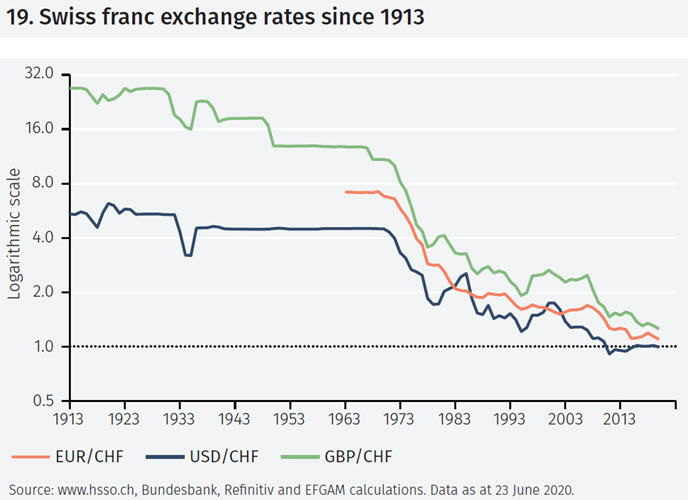
Figure 19 shows the Swiss franc exchange rates against the euro since 1963 and against the US dollar and UK pound sterling since 1913. After a period of relative stability until the 1930s, the Great Depression triggered the first wave of Swiss franc appreciation. After the Swiss franc’s only devaluation in 1936, the USD/CHF rate was unchanged until 1971. This reflected Switzerland’s de facto adherence to the Bretton Woods system of fixed exchange rates.
During the 1960s, rising US budget deficits and inflation led to pressure for a devaluation of the dollar. In August 1971, after Switzerland had already abandoned the Bretton Woods system, the US suspended gold convertibility, marking the beginning of the floating exchange rate regime and the trend appreciation of the Swiss franc.
Real and nominal rates
A rising exchange rate will not jeopardise a country’s competitiveness if it is consistent with the country’s inflation differential with its trading partners. The real, inflation-adjusted, exchange rate would then be stable. Figure 20 shows the indices of the trade-weighted nominal and real effective exchange rates of the franc (NEER and REER, respectively).8 Since 1973, the franc NEER has risen by more than 300% but the REER has remained within a relatively narrow range. A closer look at the Swiss franc REER shows it has shifted between episodes of appreciation – the shaded areas in Figure 20 – and of depreciation.9 These swings were strongly influenced by monetary policy changes in Switzerland and abroad.
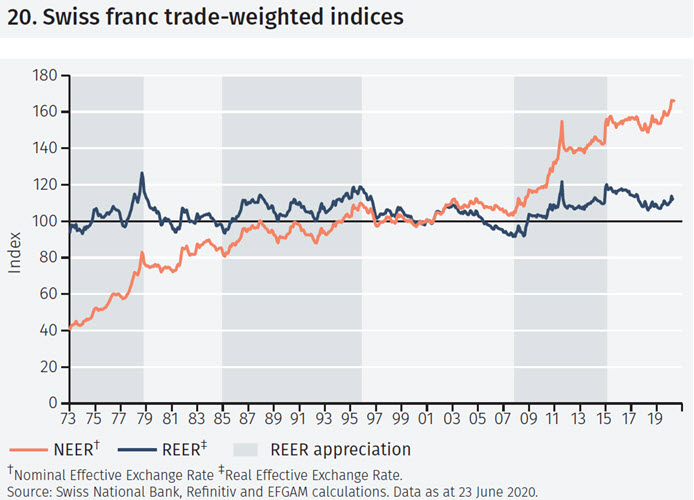
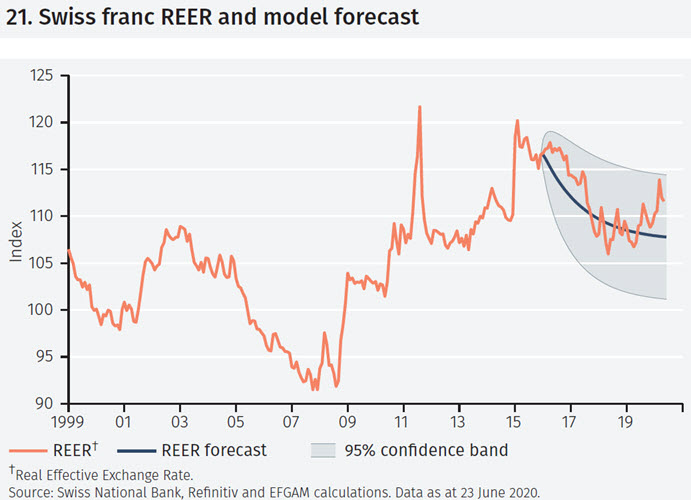
Having last peaked after the discontinuation of the EUR/CHF rate floor in January 2015, the REER has fallen by 8%, helped by the SNB’s increased interventions on currency markets. However, the past behaviour of the Swiss franc REER shows that once a peak has passed there often follows a prolonged downswing. In fact, a simple econometric model of the Swiss franc REER estimated over the January 1973-December 2015 sample period, would have forecast a falling REER since January 2016 (see Figure 21).10
Furthermore, the model suggests the Swiss franc REER is only moderately overvalued, giving credit to the SNB’s activism. Considering the SNB’s commitment to currency market interventions, the gentle decline of the Swiss franc real exchange rate seems likely to continue.
ASIA
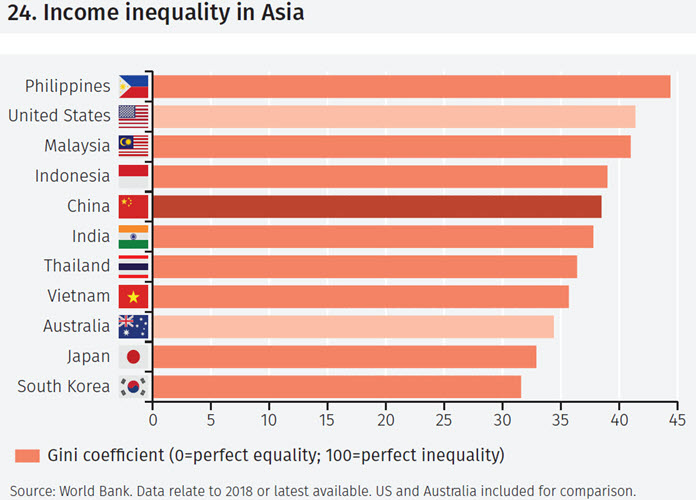
Almost certainly, China will announce that poverty has been eliminated by the end of the year. After that, attention will be on inequality. But can that be reduced without hampering economic growth?
China’s GDP growth and employment
China is set to be the only major economy growing in 2020. Although, at 1%, this will be China’s lowest growth rate since the late 1970s, there is likely to be little change in the unemployment rate (see Figure 22).
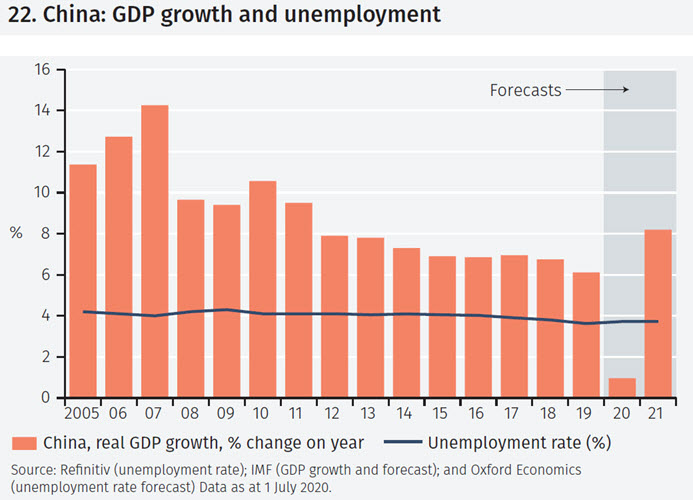
The recorded rate relates to urban unemployment and is closely tied to the status of China’s 236 million migrant workers. The hukou system allows them to register for social benefits in their (normally urban) place of work. Even so, the take-up has recently been relatively low, with migrant workers often preferring to keep their rural status (which typically brings benefits such as land ownership and access to social services). Even for those in the urban hukou system, the financial benefit of registering as unemployed is low.
Although, for these reasons, the unemployment rate remains low, progress on poverty alleviation has been rapid (see Figure 23).
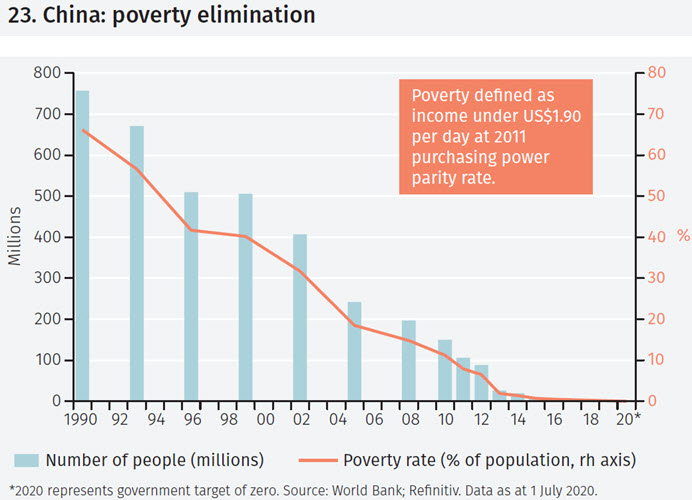
It seems highly likely that the government will declare that its aim of eliminating all poverty by the end of elimination2020 has been achieved. Even so, two-fifths of the population have an average income of less than RMB 1,000 (USD 141) per month. At the other extreme, the number of urban, high income earners has grown sharply. The result is that income inequality in China is almost as high as in the US (although still lower than in a number of other Asian economies). Some see tackling this inequality as the next aim of government. But restraining private sector pay is unlikely to advance China’s long-term growth objectives.
Japan: an unexpected boost
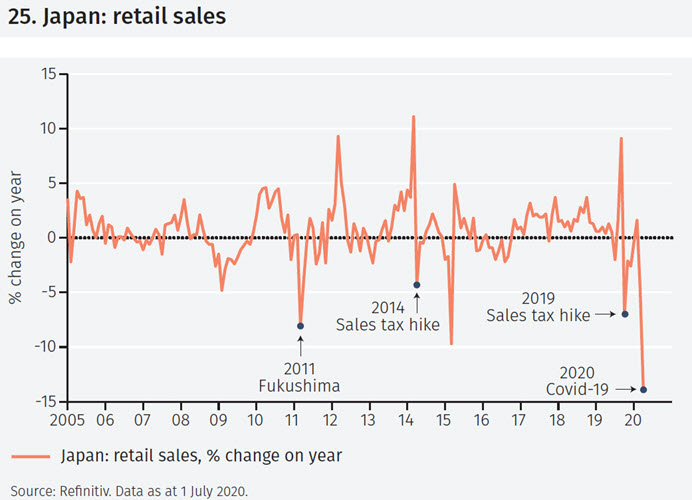
Meanwhile, Japan has announced a significant easing of fiscal policy. Amounting to 12% of GDP for on-budget items and twice as much for off-budget support, the stimulus is one of the largest in the world. As well as to offset the coronavirus impact, it reflects concern about another weakening of the domestic economy (see Figure 25). Those who thought Japan’s very high government debt level limited its ability to borrow more have had to reconsider. As in other economies, the stock market has reacted favourably to the easing.
LATIN AMERICA
Across Latin America there have been very different responses and success rates with containing the Covid-19 pandemic. Fiscal policy easing has been limited but interest rates have been cut and further monetary easing is possible.
Covid-19 response
Brazil stands at one extreme of Latin America’s response to the Covid-19 pandemic. President Bolsonaro, initially denying the significance of the virus (“it’s just a sniffle”), has opposed lockdowns, focusing on trying to maintain economic activity. However, by 1 July 2020, Brazil had registered the second largest number of Covid-19 cases and deaths in the world; and the contraction in Brazilian GDP in 2020 (9.1% on the IMF’s June 2020 forecast) is just as large as in economies with stricter lockdowns. Mexico’s President AMLO (Andrés Manuel López Obrador) was similarly relaxed in the early stages of Covid-19: “We’re going to keep living life as usual”, he said in March.
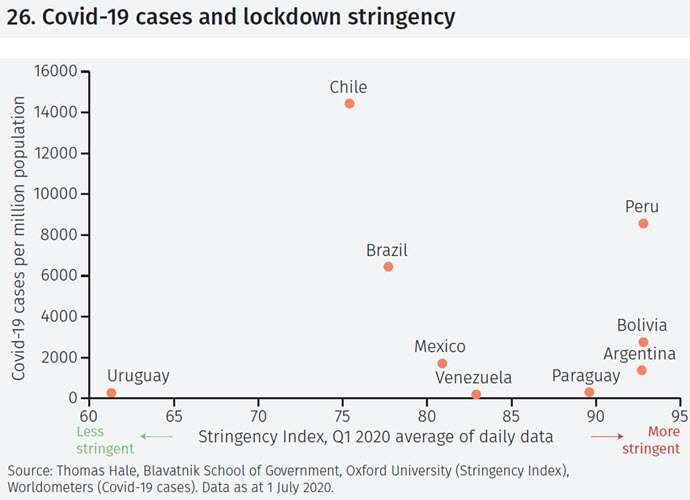
Chile, initially successful in containing the virus, now has more cases per million population than the US. In a pattern also seen in Asia there is, however, no direct relationship between the degree of lockdown stringency and the number of cases (see Figure 26). Uruguay, with less stringent measures than other countries in the region, has had fewer infections and has recorded only 27 deaths.
Fiscal and monetary response
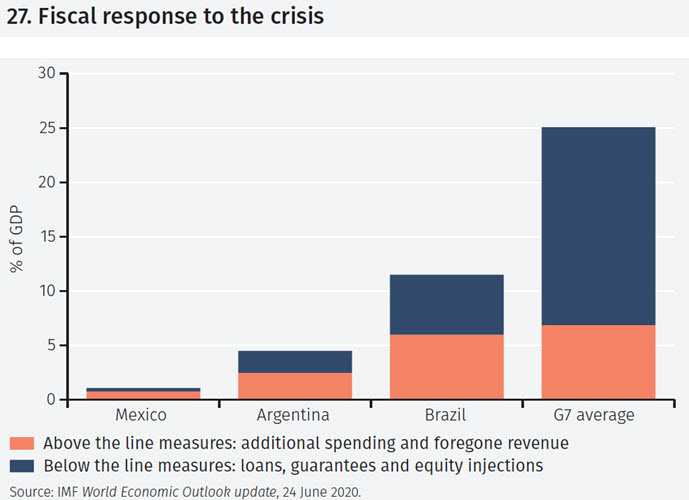
With already high levels of government budget deficits and debt levels, Latin America lacks the ‘fiscal space’ to engage in offsetting stimulus measures. The scale of the response has been smaller than in the major advanced economies (see Figure 27). Peru, Chile and Colombia have more fiscal space than others, but all are keen to avoid a large fiscal expansion, especially after hard-won progress with deficit reduction over many years.
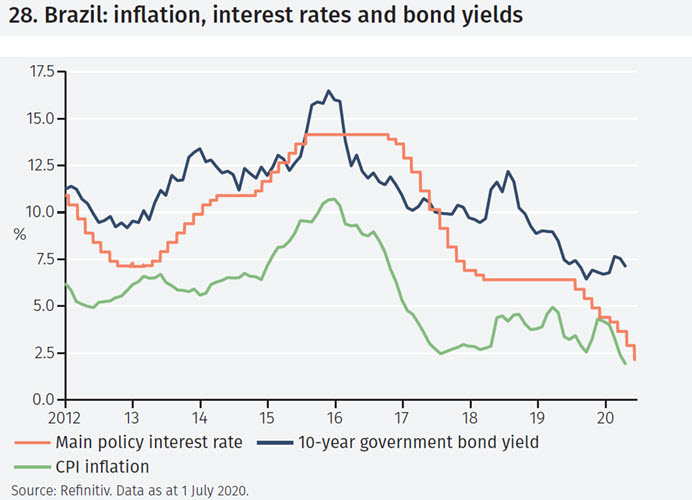
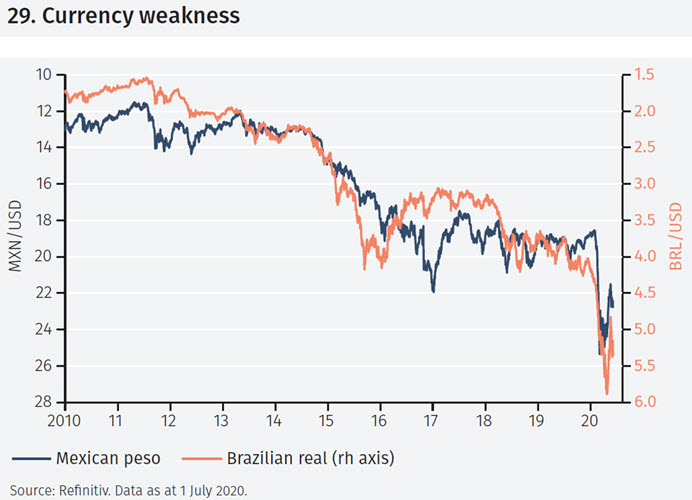
There is more scope for monetary easing, especially in Brazil, where inflation has fallen sharply (see Figure 28). Even so, in both Brazil and Mexico, the effects of currency weakness (see Figure 29) may feed through to higher inflation, making the task of policy easing more difficult. With already low official interest rates, Peru and Chile are able to use quantitative easing (not yet a feature of Latin American monetary policy) if needed.
Latin America will undoubtedly weather this latest storm; but brighter prospects may not be evident until into 2021.
SPECIAL FOCUS – ESG AFTER COVID-19
There are several ways in which the experience of the Covid-19 pandemic can help in achieving environmental, social and governance (ESG) objectives. The key is to embrace new ways of working, not return to the old pattern.
Environmental considerations
The experience of the Covid-19 pandemic can help in achieving several ESG and climate change objectives.
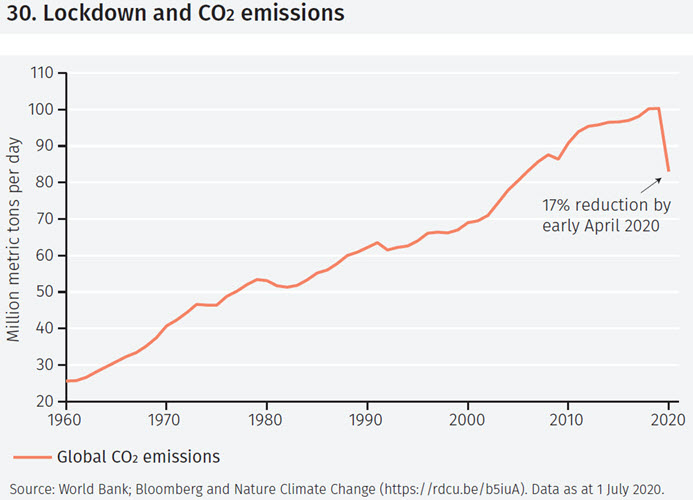
Quieter roads, lower pollution levels, clearer skies and birdsong are some of the often-cited benefits of a world in lockdown. There has been a 17% reduction in CO2 emissions (see Figure 30). The Paris Agreement’s 1.5°C global warming target needs emissions to be cut by that amount every two years by 2030. So, in a sense, the lockdown delivered two years’ of CO2 emission reductions in just four months. Of course, that reduction may not be sustained once activity recovers. But it has, at the least, demonstrated what is necessary.
Social considerations
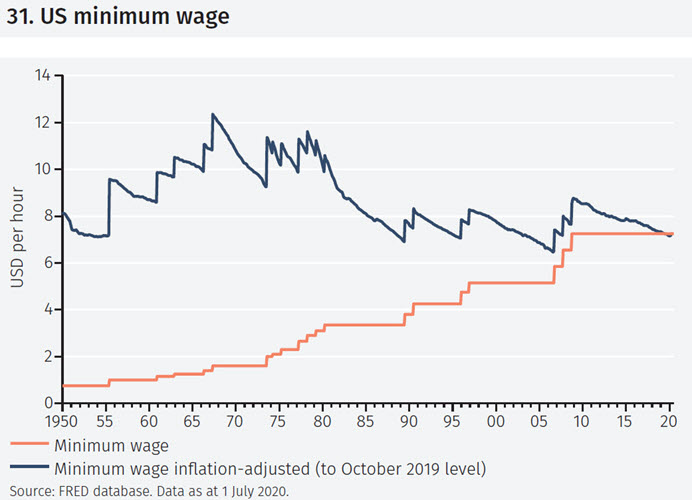
Some of the lowest paid have been key workers in many essential areas – healthcare, refuse collection and delivery, for example – during the lockdown. Companies and governments will find it hard to resist pay increases for such workers after the lockdown. In the US, the minimum wage is almost half what it was in the late 1960s (see Figure 31).
Working and living conditions will also be more closely scrutinised. Inadequate PPE (personal protective equipment) for healthcare workers in the UK, cramped and unhealthy living conditions for migrant workers in Asia and the rapid spread of the disease in care homes for the elderly have raised deep concerns about the treatment of workers around the globe.
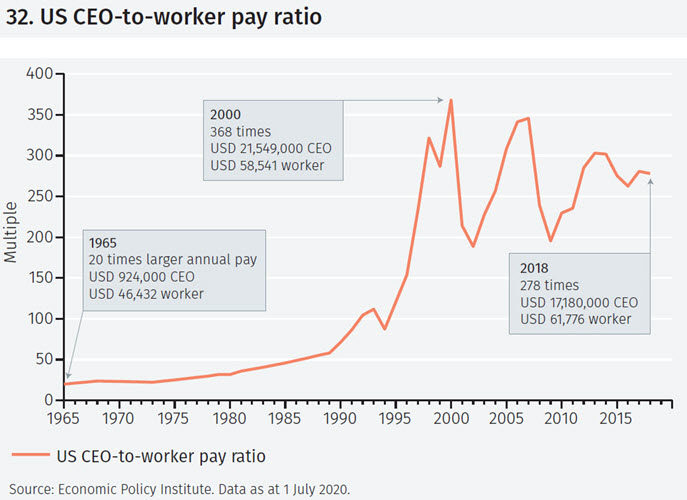
The gap between the pay of normal workers and CEOs in the US is more than ten times wider than it was in the 1960s (see Figure 32). Such a gap will be even harder to justify as social inequality receives heightened attention.
Governance
In-person corporate AGMs have often not been possible in the lockdown. Replacing these with virtual meetings is one solution which can widen attendance, participation and scrutiny. That has to be welcomed. Management has often had to make significant decisions during the lockdown – on capital raising, redundancies and pay, for example. Easier, quicker, virtual communication may enhance the scrutiny of such decisions. If so, that has to be welcomed.
Measurement of good governance is tricky. The focus is often on easily quantifiable aspects such as gender diversity and the separation of the roles of CEO and chairman. While these are important and relevant, they may not capture the many subtleties of what characterises good governance.11 The embrace of new methods of communication may make this easier.
Footnotes
1 The World Bank’s definition of global recession is based on an annual contraction in global GDP per capita, measured using GDP weights at 2010 prices and market exchange rates but is also partly judgemental. Therefore, some years registering positive growth in Figure 1 are recorded as recessions.
2 “A dangerous gap”, the cover of The Economist 9 May 2020, summed up this view.
3 IMF World Economic Outlook Update, June 2020. https://www.imf.org/en/Publications/WEO/Issues/2020/06/24/WEOUpdateJune2020
4 The Bloomberg Barclays Global Aggregate Bond Index is a benchmark of government and investment grade corporate debt from developed and emerging markets issuers in 24 countries
5 https://www.thebalance.com/us-deficit-by-year-3306306#deficit-by-year-since-1929.
6 Source: Nasdaq and MSCI as at 1 July 2020.
7 Under Alexander Hamilton, the first US Treasury Secretary, the US federal government assumed and honoured all of the debts individual states had run up during the Revolutionary War.
8 The analysis considers the producer price index (PPI)-adjusted REER as it better reflects the relative development of tradeable goods prices.
9 An episode of appreciation goes from a major trough to a major peak. A major trough is identified when it is lower than the previous and successive minor lows and it is at least two standard deviations below trend. Accordingly, a major peak is identified when it higher than the previous and successive minor peaks and it is at least two standard deviations above trend. The exception is the 2008-2015 period where the peak after the discontinuation of the exchange rate floor is considered as the end of the Swiss franc appreciation episode.
10 In the model, the monthly change of the REER is estimated as a function of its past changes and of the gap between its level and the underlying trend.
11 A point made by Jason Jay, EFGAM Future leaders panellist, on our recent Beyond the benchmark podcast, episode 13.
Important Information
The value of investments and the income derived from them can fall as well as rise, and past performance is no indicator of future performance. Investment products may be subject to investment risks involving, but not limited to, possible loss of all or part of the principal invested.
This document does not constitute and shall not be construed as a prospectus, advertisement, public offering or placement of, nor a recommendation to buy, sell, hold or solicit, any investment, security, other financial instrument or other product or service. It is not intended to be a final representation of the terms and conditions of any investment, security, other financial instrument or other product or service. This document is for general information only and is not intended as investment advice or any other specific recommendation as to any particular course of action or inaction. The information in this document does not take into account the specific investment objectives, financial situation or particular needs of the recipient. You should seek your own professional advice suitable to your particular circumstances prior to making any investment or if you are in doubt as to the information in this document.
Although information in this document has been obtained from sources believed to be reliable, no member of the EFG group represents or warrants its accuracy, and such information may be incomplete or condensed. Any opinions in this document are subject to change without notice. This document may contain personal opinions which do not necessarily reflect the position of any member of the EFG group. To the fullest extent permissible by law, no member of the EFG group shall be responsible for the consequences of any errors or omissions herein, or reliance upon any opinion or statement contained herein, and each member of the EFG group expressly disclaims any liability, including (without limitation) liability for incidental or consequential damages, arising from the same or resulting from any action or inaction on the part of the recipient in reliance on this document.
The availability of this document in any jurisdiction or country may be contrary to local law or regulation and persons who come into possession of this document should inform themselves of and observe any restrictions. This document may not be reproduced, disclosed or distributed (in whole or in part) to any other person without prior written permission from an authorised member of the EFG group.
This document has been produced by EFG Asset Management (UK) Limited for use by the EFG group and the worldwide subsidiaries and affiliates within the EFG group. EFG Asset Management (UK) Limited is authorised and regulated by the UK Financial Conduct Authority, registered no. 7389746. Registered address: EFG Asset Management (UK) Limited, Leconfield House, Curzon Street, London W1J 5JB, United Kingdom, telephone +44 (0)20 7491 9111.
Please use the button below to download the full article.